
A supply chain is governed on private books, and the public statistics reach only its edges
American business held an average of 2,663 billion dollars of inventory across 2025, 35.1 percent above 2020, and that buffer is the working instrument of resilience. The series records its size and nothing else: not who holds it, not against which supplier, not where the next tier sits.
by
Vantage point
The vantage decides what follows, so it should be stated first. I am an analyst writing inside The Cefa Brief, working from published statistics and public documents and from nothing else: annual series redistributed by FRED and retrieved for this site on 19 September 2026, together with the agencies' own documentation of what each series counts. I sit in no firm and hold no brief from any government. Nothing below rests on a conversation, a contract, a shipping record or a figure that has not been published.
Published 6 minute read

Иллюстрация: The Cefa Brief
Resilience policy is written as though a supply chain were a thing a government could hold. It is not. A supply chain is a set of standing arrangements between firms about what will be bought, from whom, and how much of it will be kept on hand against the day the arrangement fails. The last of those decisions is the one that does the work, and it is taken on a private balance sheet. American business held an average of 2,663 billion dollars of inventory across 2025, 35.1 percent above the 1,971 billion it held in 2020. That is the buffer the country actually has. No public series says who holds it or what it is held against.
Where this is written from
The vantage decides what follows, so it should be stated first. I am an analyst writing inside The Cefa Brief, working from published statistics and public documents and from nothing else: annual series redistributed by FRED and retrieved for this site on 19 September 2026, together with the agencies' own documentation of what each series counts. I sit in no firm and hold no brief from any government. Nothing below rests on a conversation, a contract, a shipping record or a figure that has not been published.
What that position sees, it sees plainly. It sees the national aggregates the statistical agencies have chosen to publish, at the frequency they publish them, with the coverage they declare. It does not see a single sourcing decision. Which firm buys from which, how many suppliers stand behind a given part, whether a plant three tiers back has one customer or forty, whether a contract was renewed in March: none of that reaches a national annual series, and I will not read it out of one. The claim this piece can defend is about what the public record contains, not about what happened inside it.
The buffer is the instrument
Total business inventories run 1,971 billion dollars in 2020, 2,101 in 2021, 2,490 in 2022, 2,584 in 2023, 2,619 in 2024 and 2,663 in 2025, each point the average of that year's twelve monthly readings rather than a total for the year. The steps between them are 130, then 389, then 94, then 35, then 44. One year did most of the work: the 389 billion added in 2022 is larger than the 173 billion added across the three years that followed it combined. Firms rebuilt their cover in a single stretch and have added to it slowly since.
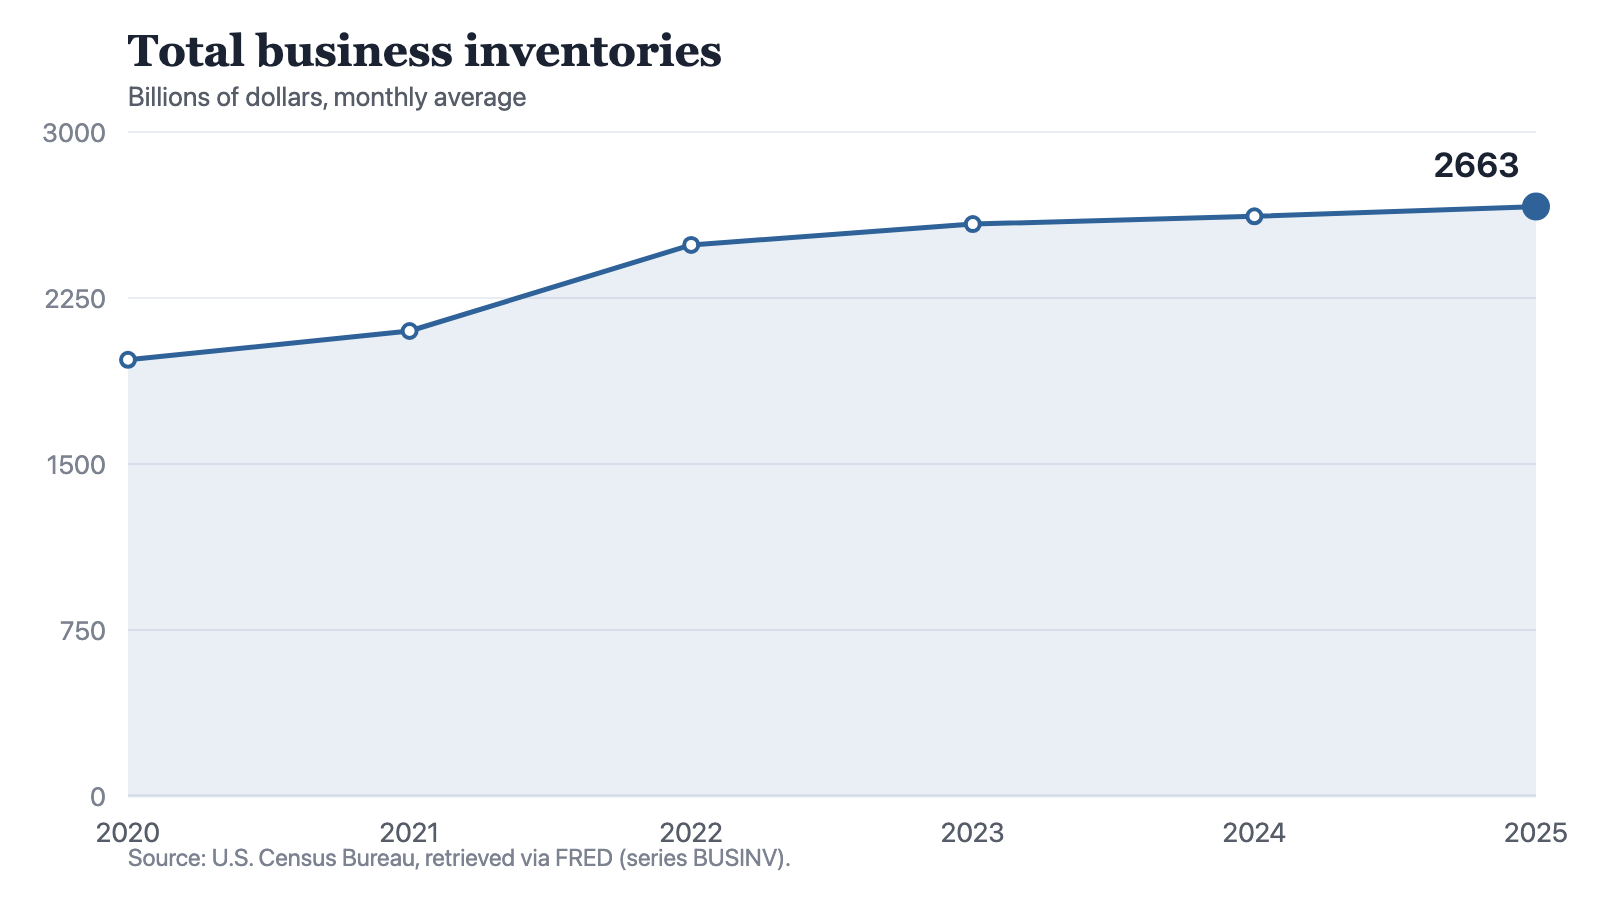
Notes: Annual observations of series BUSINV, U.S. Census Bureau, in billions of dollars at a monthly average. Each point is the average of the year's twelve monthly readings, a level held rather than a total accumulated; the months are not summed. The series carries no breakdown by industry, holder or item.
Source: The Cefa Brief
Chart description
A line chart showing total business inventories at 1,971 billion dollars in 2020, 2,101 in 2021, 2,490 in 2022, 2,584 in 2023, 2,619 in 2024 and 2,663 in 2025. The line rises at every step, steeply between 2021 and 2022 and much more gently at each of the three steps after it.
A line chart showing total business inventories at 1,971 billion dollars in 2020, 2,101 in 2021, 2,490 in 2022, 2,584 in 2023, 2,619 in 2024 and 2,663 in 2025. The line rises at every step, steeply between 2021 and 2022 and much more gently at each of the three steps after it.
Nothing in those six numbers tells you what the buffer is for. The series is one national total. It does not say which industries hold the stock, whether it sits with the manufacturer or two steps downstream from it, how much of it is a part with a single source, or how many weeks of production any of it would cover. A government deciding how much of a critical good to stockpile is making a decision about the same quantity from the outside, with less information than the firms already holding it, and this publication carries no figure at all for what the state itself holds. That absence is the shape of the problem rather than a gap in the reporting.
Legible only at the border
There is one place where the arrangements between firms become visible, and it is the customs line. U.S. goods imports from China run 36 billion dollars in 2020, 42 in 2021, 45 in 2022, 36 in 2023, 37 in 2024 and 26 in 2025, each figure a monthly average rather than a year's imports. From the 2022 reading to the 2025 one the monthly flow falls by 19 billion dollars, or 42.2 percent, and the 11 billion drop in the final year is the largest single move in the window. That is a large fall in a recorded value, and no figure here is adjusted for prices, so it is a fall in dollars rather than a measured fall in quantity. The series records the dollars and stops there: it cannot say what replaced the goods, whether a Chinese component now arrives inside something assembled elsewhere, or whether the same supplier is still standing behind the same part one tier back.
Resilience is a property of the links between firms. Every series here measures a boundary those links cross, and not one of them measures a link.
The surfaces that remain
Orders are the instruction that actually moves a chain, and through the middle of this window the aggregate barely moved. Manufacturers new orders run 437 billion dollars in 2020, 525 in 2021, 589 in 2022, 591 in 2023, 587 in 2024 and 611 in 2025, again a monthly average and not a yearly total. Across 2022, 2023 and 2024 the series moves between 587 and 591, a spread of 4 billion dollars in three years, before adding 24 billion in 2025. A flat aggregate is consistent with a settled system and equally consistent with a great deal of churn beneath it, one supplier replaced by another at the same price. The published total cannot tell those two states apart, which is precisely the distinction resilience policy cares about.
Prices and output indexes complete the visible surface and confirm its limits. Producer prices in chemical manufacturing, on a December 1984 base of 100, run 289, 322.8, 359.6, 356.5, 352.2 and 356.5 across the six years; all-commodity producer prices, on a 1982 base, run 194.4, 227.3, 264.5, 255.7, 254.6 and 260.3. Both rose by nearly the same number of index points between 2020 and 2022, 70.6 and 70.1, and that near-identity means nothing, because the bases differ and point moves across different bases are not comparable; in percentage terms the moves are 24.4 and 36.1. The two output indexes share a base, 2017 equals 100, and so can be compared directly: semiconductor production went from 121 in 2021 to 165 in 2025, a gain of 44 points or 36.4 percent, while computer and electronic product output went from 110.3 to 126.8, a gain of 16.5 points or 15.0 percent. Semiconductors are one component category within computer and electronic products, and the component has moved further than the category containing it. Which firms bought those chips, and from whom, appears in neither index.
What follows for resilience policy
Policy acts on what it can measure, and the measurable surface of a supply chain is its outer edge: a customs line, a price quote, an order book, a national inventory total. Stockpiles, content rules and screening all operate on that edge, and each can be administered without knowing a single supplier relationship, which is why they are the instruments that get built. The governance that decides whether a chain survives a shock happens one and two and three tiers in, where a firm chooses a second source or declines to pay for one, and no series in this publication observes that choice. The honest version of the case for resilience policy therefore begins with an admission rather than a number: the state is legislating about a system whose structure it cannot see, using statistics that were built to count flows and prices rather than relationships. A register of who supplies whom would change that, and the absence of one is not an oversight but an unmade decision. Until it is made, the strongest sentence available from this vantage is a narrow one. American firms hold a large and slowly growing buffer, the recorded dollar value of what they buy directly from one country has fallen sharply, and their aggregate orders stood still for three years before rising again in 2025. Why any of those three things happened is not in the public record, and a policy that assumes otherwise is assuming.
How to cite
Jag DeSaint, "A supply chain is governed on private books, and the public statistics reach only its edges," The Cefa Brief, Applied America, 3 сентября 2026 г., https://applied.thecefa.org/cefa-brief/no-series-counts-a-supplier.
About the author

Each author told us that for this piece they hold no interest a reader would think relevant.
This Perspectives piece carries its author's name because the view in it is the author's own. An editor reviewed it before publication, which is not the same as agreeing with it. It is not a position of the Center for Economics & Foreign Affairs or of Applied America.
© 2026. The author or authors hold the copyright in this Perspectives piece; CEFA publishes it with their permission. This edition, its editing and its presentation are © 2026 Center for Economics & Foreign Affairs. To republish it, see our republication terms. Republishing
Share
The Cefa Brief · applied.thecefa.org/cefa-brief/no-series-counts-a-supplier · Printed from the web edition