
Each yearly fall in housing starts has been smaller than the one before it
The starts rate has declined in four consecutive observations, but the declines are shrinking: 0.05, then 0.13, then 0.05, then 0.01. The last of those is one unit in the final published digit, which means the series has stopped moving at a level below where it began in 2020.
by
Published 4 minute read

Иллюстрация: The Cefa Brief
Housing starts in 2025 ran at 1.36 million units a year, the lowest of the six annual readings this site holds and below the 1.39 million recorded in 2020. That much is easy to see in the series. What is less often taken from it is the shape of how the rate got there, which is the more informative half of the data.
The run is short enough to read in one line. 1.39 in 2020, 1.6 in 2021, 1.55 in 2022, 1.42 in 2023, 1.37 in 2024, 1.36 in 2025. One rise, at the front, and then four consecutive declines. In six years of data there is exactly one observation in which the rate of housing construction increased, and it is the first observation after 2020.
Four steps down, each smaller than the last
From the 2021 high of 1.6 the series gave up 0.05, then 0.13, then 0.05, then 0.01. The largest single drop was between 2022 and 2023. Every step since has been smaller than the one before it. Peak to latest the rate has given back 0.24 million units a year, which is fifteen percent of the 2021 reading, but almost none of that loss is recent.
The most recent step deserves particular care, and it is where most readings of this series go wrong. The figures are published to two decimal places, so a move from 1.37 to 1.36 is one unit in the last digit available. The honest description of 2024 to 2025 is that the rate did not visibly move. Anyone reading that step as a continuing decline is reading more than the series says; anyone reading it as a bottom is reading a great deal more than that.
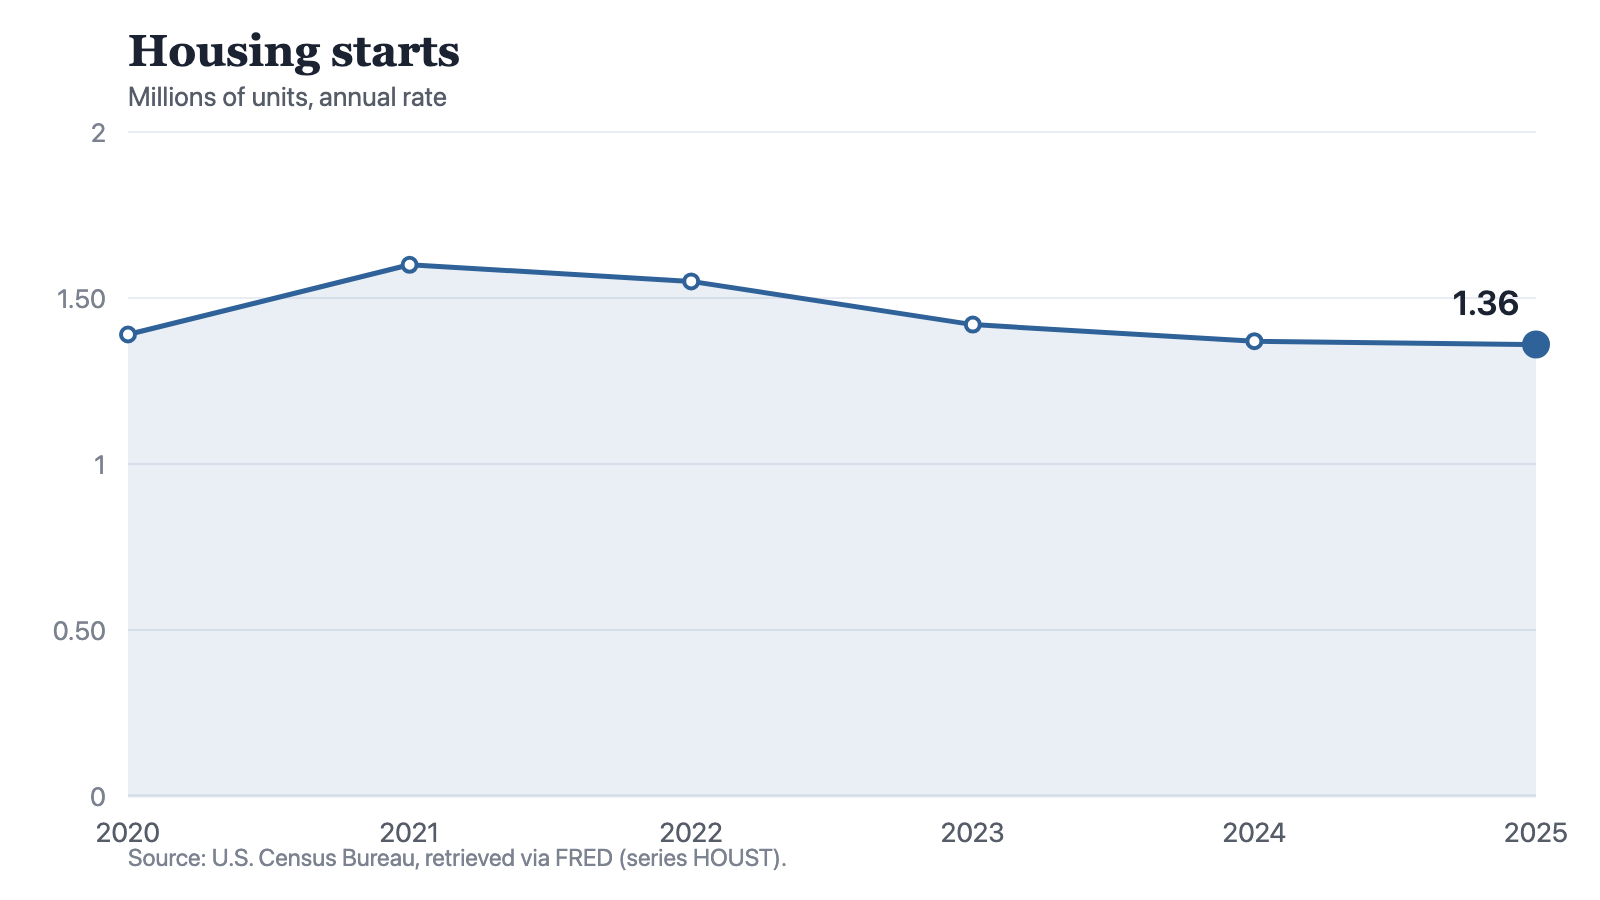
Notes: Annual observations of a rate expressed at an annual pace. Source: U.S. Census Bureau, retrieved via FRED (series HOUST). Retrieved 19 September 2026.
Source: The Cefa Brief
Chart description
The line begins at 1.39 million in 2020, rises to its only peak of 1.6 million in 2021, and then declines in each of the four following observations: 1.55 in 2022, 1.42 in 2023, 1.37 in 2024 and 1.36 in 2025. The steps are 0.05, 0.13, 0.05 and 0.01 — the 2022 to 2023 fall is the largest in the series and the 2024 to 2025 fall is the smallest, amounting to one unit in the last published decimal place.
The line begins at 1.39 million in 2020, rises to its only peak of 1.6 million in 2021, and then declines in each of the four following observations: 1.55 in 2022, 1.42 in 2023, 1.37 in 2024 and 1.36 in 2025. The steps are 0.05, 0.13, 0.05 and 0.01 — the 2022 to 2023 fall is the largest in the series and the 2024 to 2025 fall is the smallest, amounting to one unit in the last published decimal place.
A decelerating fall is a different object
A decline that shrinks each year and a decline that holds its pace are two different things, and they call for different responses. A steady rate of decline implies a force still acting: a cost that keeps rising, a constraint that keeps tightening. A decline that fades to nothing implies the adjustment has largely happened and the series has found a level it can sit at.
This series has the second shape. Exactly three quarters of the total fall from the 2021 peak was complete by 2023: 0.18 of the 0.24. The two years since have produced a combined movement of 0.06, and the most recent of them contributed 0.01 of that. Whatever pushed starts down did most of its work early and has not been adding much to the effect since.
For anyone sizing capacity against this series, that distinction is the whole of the practical content. A market still falling at 0.13 a year is one you plan to shrink into. A market that has been within 0.06 of the same number for three years is one you plan around. The six readings do not tell you which way it breaks next, but they do tell you that the last two years carry far less information about direction than the two before them, and should be weighted accordingly.
The question is no longer why starts are falling. It is why, having stopped falling, they have not started rising.
What a rate does not tell you
It is worth being exact about what is being measured, because the word rate does a lot of quiet work. This series reports a pace at which units were begun, expressed at an annual rate. It is not a count of homes completed, not a count of homes sold, and not an addition to the housing stock. A unit started in one year may be finished in the next or not finished at all. The series sits at the front of the pipeline and says nothing about what comes out of the back of it.
Nor does it localise. These are national figures, and a national starts rate cannot say whether the shortfall is concentrated in a handful of expensive metropolitan markets or spread evenly across the country. This dataset has no sub-national detail and no monthly path. A reader who needs to know where building is not happening needs a different file than this one.
The obvious candidate explanation is the cost of money. The ten-year Treasury yield in this dataset runs 0.89, 1.45, 2.95, 3.96, 4.21, 4.29, rising in every single observation. That is the right series to have in mind while reading the starts line and it is nowhere near enough to prove anything: the long end kept climbing through 2024 and 2025, the period in which the falls in starts shrank to almost nothing. If the cost of borrowing alone were driving this, the last two observations would look different from the way they do.
So the defensible finding is narrower than the headlines around this series and more awkward than either of the stories usually told about it. Housing starts are not in freefall, and they are not recovering. They fell hard and early, then settled. A number that has stopped moving generates no news and forces no decision, which is exactly why it is worth printing the shape of the fall rather than only its destination.
Method and data
Housing starts here are the series HOUST as published by the U.S. Census Bureau and redistributed by FRED, retrieved for this site on 19 September 2026. The figures are annual observations of a rate expressed at an annual pace, in millions of units.
A rate is not a count. A reading of 1.36 for 2025 describes the pace at which units were begun. It is not a number of homes completed, sold, occupied or added to the stock, and none of those quantities can be recovered from this series.
The series is published here to two decimal places. Differences at the second decimal, such as the 0.01 between 2024 and 2025, are at the limit of what these figures resolve and are treated as such throughout this piece.
The ten-year Treasury yield is the series DGS10, annual observations retrieved on the same date, and appears only as context. Six annual points on two series cannot establish that one moved the other, and nothing here should be read as an estimate of that relationship.
These are national figures. This dataset holds no state, metropolitan or county detail for starts and no monthly detail, so there is no seasonality and no within-year turning point to be read from it.
How to cite
Jag DeSaint, "Each yearly fall in housing starts has been smaller than the one before it," The Cefa Brief, Applied America, 10 сентября 2026 г., https://applied.thecefa.org/cefa-brief/housing-starts-lowest-of-six-readings.
About the author

Each author told us that for this piece they hold no interest a reader would think relevant.
This Insights piece carries its author's name because the view in it is the author's own. An editor reviewed it before publication, which is not the same as agreeing with it. It is not a position of the Center for Economics & Foreign Affairs or of Applied America.
© 2026. The author or authors hold the copyright in this Insights piece; CEFA publishes it with their permission. This edition, its editing and its presentation are © 2026 Center for Economics & Foreign Affairs. To republish it, see our republication terms. Republishing
Share
The Cefa Brief · applied.thecefa.org/cefa-brief/housing-starts-lowest-of-six-readings · Printed from the web edition