
Ten of fifty-one jurisdictions are concentrated in both production and engineering work, and the record cannot show a cluster forming in any of them
Twenty-five jurisdictions employ production workers more intensively than the nation and twenty-three do the same for architecture and engineering, but only ten do both. The rate at which people quit a job, which is the closest thing the record holds to the movement a cluster runs on, gave its lowest reading of the window in 2025.
by
Vantage point
I am an analyst working from published statistics and public documents, and from nothing else. Every figure below is either an annual observation in a federal series retrieved for this site on 19 September 2026, or a value in the 2025 occupational file, which carries the same twenty-two occupational groups for all fifty states and the District of Columbia. What that position gives is comparability. One measure, taken on one basis, across every jurisdiction at once, with absences recorded rather than filled in. What it cannot give is anything below the state line, anything about a supplier relationship, and anything about a decision. No file held here records which firms buy from which, where inside a state a plant sits, why a company chose one county over another, or whether a building that was started was ever finished. A cluster is a sub-state object and the finest geography in this record is a state. I am measuring something smaller than my instrument, and that is better said at the top than discovered at the bottom.
Published 7 minute read

Иллюстрация: The Cefa Brief
Where this is written from
I am an analyst working from published statistics and public documents, and from nothing else. Every figure below is either an annual observation in a federal series retrieved for this site on 19 September 2026, or a value in the 2025 occupational file, which carries the same twenty-two occupational groups for all fifty states and the District of Columbia. What that position gives is comparability. One measure, taken on one basis, across every jurisdiction at once, with absences recorded rather than filled in. What it cannot give is anything below the state line, anything about a supplier relationship, and anything about a decision. No file held here records which firms buy from which, where inside a state a plant sits, why a company chose one county over another, or whether a building that was started was ever finished. A cluster is a sub-state object and the finest geography in this record is a state. I am measuring something smaller than my instrument, and that is better said at the top than discovered at the bottom.
A second limit belongs alongside the first. The national series here carry five or six annual observations each, and the occupational file carries one year, 2025, with no earlier year beside it. A cluster forms over decades. Nothing in this record is the history of a place. What follows is a structural argument checked against a snapshot, and it is not an account of anything forming.
Three ingredients, and the record counts one
An industrial cluster, stripped to its parts, is three things at once. It is a pool of workers with the relevant skills, deep enough that a firm can hire without importing. It is a web of suppliers close enough to be visited in a morning. And it is a rate of movement, people changing employers inside the same trade and carrying what they know across the car park. Of those three, the published record holds the first properly, holds the third only as a national average, and does not hold the second at all. No file here records which firm buys from which. That absence is not a gap waiting to be filled. It is the reason most claims made about clusters cannot be checked at all.
The first ingredient is measured well. The occupational file gives the definition in its own header: the location quotient is the occupation's share of this state's jobs divided by its share of national jobs, so above 1 means more concentrated than the nation. That is a clean instrument. Its problem is scale. The finest geography in this record is a state, and a cluster is not a state. It is a corridor, a metropolitan area, a few counties either side of a river. The reading is accurate at the scale it is taken and too coarse for the object it is taken of, and every count below inherits that.
The making and the designing sit in different states
Take the two occupational groups an industrial cluster needs at the same address. Production Occupations is the making. Architecture and Engineering Occupations is the designing. Of the fifty-one jurisdictions in the 2025 file, twenty-five carry a production quotient above 1 and twenty-three carry an engineering quotient above 1. Ten carry both. Fifteen are above 1 in production alone, thirteen in engineering alone, and thirteen in neither, and those four counts come to fifty-one. The threshold is strictly above 1, which matters at the edge: Oregon and Rhode Island sit at exactly 1 in production, the District of Columbia sits at exactly 1 in engineering, and none of the three is counted as concentrated.
The ten are Alabama, Wisconsin, Michigan, Kansas, Ohio, South Carolina, Minnesota, Utah, Idaho and New Hampshire. Between them they hold 2,069,420 of the 8,565,750 production jobs the file records across the fifty-one, which is 24.2 percent, and 528,700 of the 2,617,100 engineering jobs, which is 20.2 percent. So about a fifth to a quarter of each half of the industrial workforce sits in a jurisdiction concentrated in the other half as well. Every one of the fifty-one holds both kinds of work and the file publishes a count for both, so the remainder is not an absence. It is each half sitting where the other half is present and not concentrated. The extremes of the two rankings make the same point more sharply. Indiana holds the highest production quotient in the file at 2.01 and an engineering quotient of 0.97, which is below the national rate. New Mexico holds the highest engineering quotient at 1.85 and a production quotient of 0.60. Two jurisdictions appear in the top six of both lists: Michigan, at 1.72 and 1.76, and Alabama, at 1.85 and 1.39.
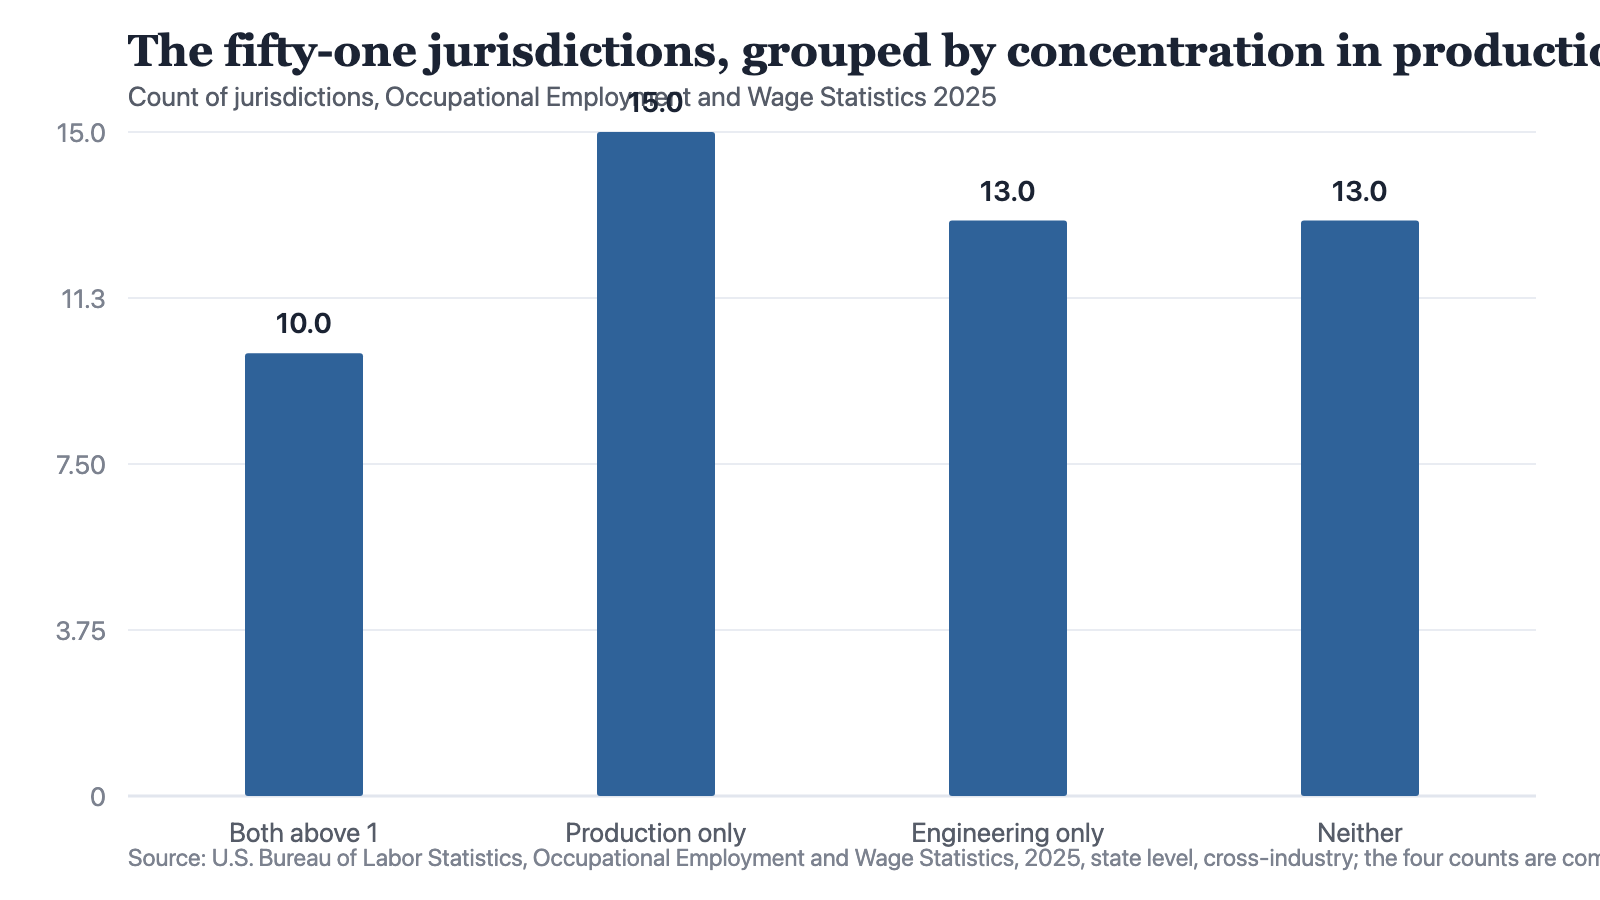
Notes: Source: U.S. Bureau of Labor Statistics, Occupational Employment and Wage Statistics, 2025, state level, cross-industry; the four counts are computed for this piece from the fifty-one published location quotients. Three jurisdictions sit at exactly 1 and are counted as not concentrated: Oregon and Rhode Island in production, the District of Columbia in engineering.
Source: The Cefa Brief
Chart description
A bar chart of four groups covering all fifty-one jurisdictions in the 2025 occupational file, sorted by whether each carries a location quotient strictly above 1 for Production Occupations, for Architecture and Engineering Occupations, for both or for neither. Above 1 in both: 10 jurisdictions. Above 1 in production only: 15. Above 1 in engineering only: 13. Above 1 in neither: 13. The four bars sum to 51, and the shortest bar is the one counting jurisdictions concentrated in both kinds of work.
A bar chart of four groups covering all fifty-one jurisdictions in the 2025 occupational file, sorted by whether each carries a location quotient strictly above 1 for Production Occupations, for Architecture and Engineering Occupations, for both or for neither. Above 1 in both: 10 jurisdictions. Above 1 in production only: 15. Above 1 in engineering only: 13. Above 1 in neither: 13. The four bars sum to 51, and the shortest bar is the one counting jurisdictions concentrated in both kinds of work.
Twenty-five jurisdictions are concentrated in the making and twenty-three in the designing. Ten are concentrated in both. A policy that does not know which of those lists it is buying into is not a cluster policy.
The part a budget cannot buy
Movement is the third ingredient, and the only reading on it in this record is national and indirect. The rate at which people quit a job, stated as a percent of employment, runs 2.1 in 2020, 2.7 in 2021, 2.8 in 2022, 2.4 in 2023, 2.1 in 2024 and 2 in 2025. Each point is an annual average of that rate. It counts voluntary separations and does not record where the person went next, so it stands in for movement rather than measuring it. The last reading is the lowest of the six and sits 0.8 points below the 2022 high. Firm entry, the other route by which knowledge leaves one company and turns up in another, runs alongside it. New business applications, in thousands, averaged 84 a week in 2020 and 109 a week in 2025, a rise of 25; each point there is the average of that year's weeks and not the year's total. Neither series carries a geographic split in this record. So I cannot tell a reader whether workers move more freely inside the ten jurisdictions than outside them, and that is exactly what a theory of clusters predicts. The central mechanism is not testable from the published record.
What policy actually procured
Set against that, consider what the money bought. Construction spending on manufacturing plant, in billions of dollars at a seasonally adjusted annual rate, runs 75 in 2020, 82 in 2021, 125 in 2022, 202 in 2023, 244 in 2024 and 215 in 2025. Each point is a yearly rate and approximates the year. The rise from the first reading to the 2024 peak is 169 billion, and the most recent reading is 29 billion below that peak. A building is the one ingredient on the list a government can specify, order and take delivery of. It is also the one a cluster does not need supplied, because a place that already has the workforce and the suppliers has already built its own. Over the same window the aggregates rise and then give part of the rise back, and each one turns before the spending does. Manufacturing employment runs 12.1 million in 2020, peaks in 2023 at 12.9 million and reads 12.6 million in 2025, which is 0.3 million below that peak and 0.5 million above the first reading. Manufacturing output, on a 2017 base of 100, runs 93 in 2020, peaks at 98 in 2022 and reads 97.3 in 2025, the same figure as 2023 and 2.7 points under its own base. Capacity in use runs 72.9 percent in 2020, peaks at 77.6 percent in 2022 and reads 75.3 percent in 2025. All three peaks, 2022 for output and for capacity and 2023 for employment, arrived before the 2024 construction peak rather than after it. That ordering is not a finding about cause, in either direction. It is a reason to be careful with a record in which the spending peaks last.
What the record cannot settle, and what it can
One sector did move. Semiconductor production, on the same 2017 base, runs 121 in 2021, 131 in 2022, 135 in 2023, 144 in 2024 and 165 in 2025, a gain of 44 index points, of which 21 arrived in the final step, the largest of the four. Why it moved is not a question this record answers. It holds no award, no site decision, no plant opening and no counterfactual, and an index cannot be cross-examined about its causes. What the record can do is supply a precondition and let it be checked before money moves, which is a smaller claim and a usable one. The occupational quotients are published, they cover every jurisdiction on one basis, and they can be read in an afternoon. A plan to start a cluster where neither half of the workforce is concentrated is not wrong on that account. It is a plan to supply the two ingredients that cannot be ordered on top of the one that can, and it ought to be costed that way and said out loud.
How to cite
Jag DeSaint, "Ten of fifty-one jurisdictions are concentrated in both production and engineering work, and the record cannot show a cluster forming in any of them," The Cefa Brief, Applied America, 9 сентября 2026 г., https://applied.thecefa.org/cefa-brief/a-cluster-is-smaller-than-a-state.
About the author

Each author told us that for this piece they hold no interest a reader would think relevant.
This Perspectives piece carries its author's name because the view in it is the author's own. An editor reviewed it before publication, which is not the same as agreeing with it. It is not a position of the Center for Economics & Foreign Affairs or of Applied America.
© 2026. The author or authors hold the copyright in this Perspectives piece; CEFA publishes it with their permission. This edition, its editing and its presentation are © 2026 Center for Economics & Foreign Affairs. To republish it, see our republication terms. Republishing
Share
The Cefa Brief · applied.thecefa.org/cefa-brief/a-cluster-is-smaller-than-a-state · Printed from the web edition