
The policy rate has given back less than a fifth of its climb
On annual averages the federal funds rate rose 5.06 percentage points from its 2021 low to its 2024 peak, then fell 0.93. Everything priced against the policy rate is still being priced against most of the increase.
by
Published 3 minute read

Ilustração: The Cefa Brief
The story most readers carry about interest rates has two halves: rates went up, and rates are coming down. The second half is doing far more work in conversation than it does in the data. Measured on annual averages, the federal funds effective rate has returned less than a fifth of what it added.
The low point in this window is 0.08 percent, the 2021 average. The high point is 5.14 percent, the 2024 average. That is a climb of 5.06 percentage points. The single move down since then, from 2024 to 2025, is 0.93 points. That retreat is about 18 percent of the climb.
The climb arrived in one year, not four
The shape of the ascent matters as much as its size. From 2021 to 2022 the average rose 1.60 points, to 1.68 percent. From 2022 to 2023 it rose 3.34 points, to 5.02 percent. That one step is about two thirds of the entire increase from trough to peak.
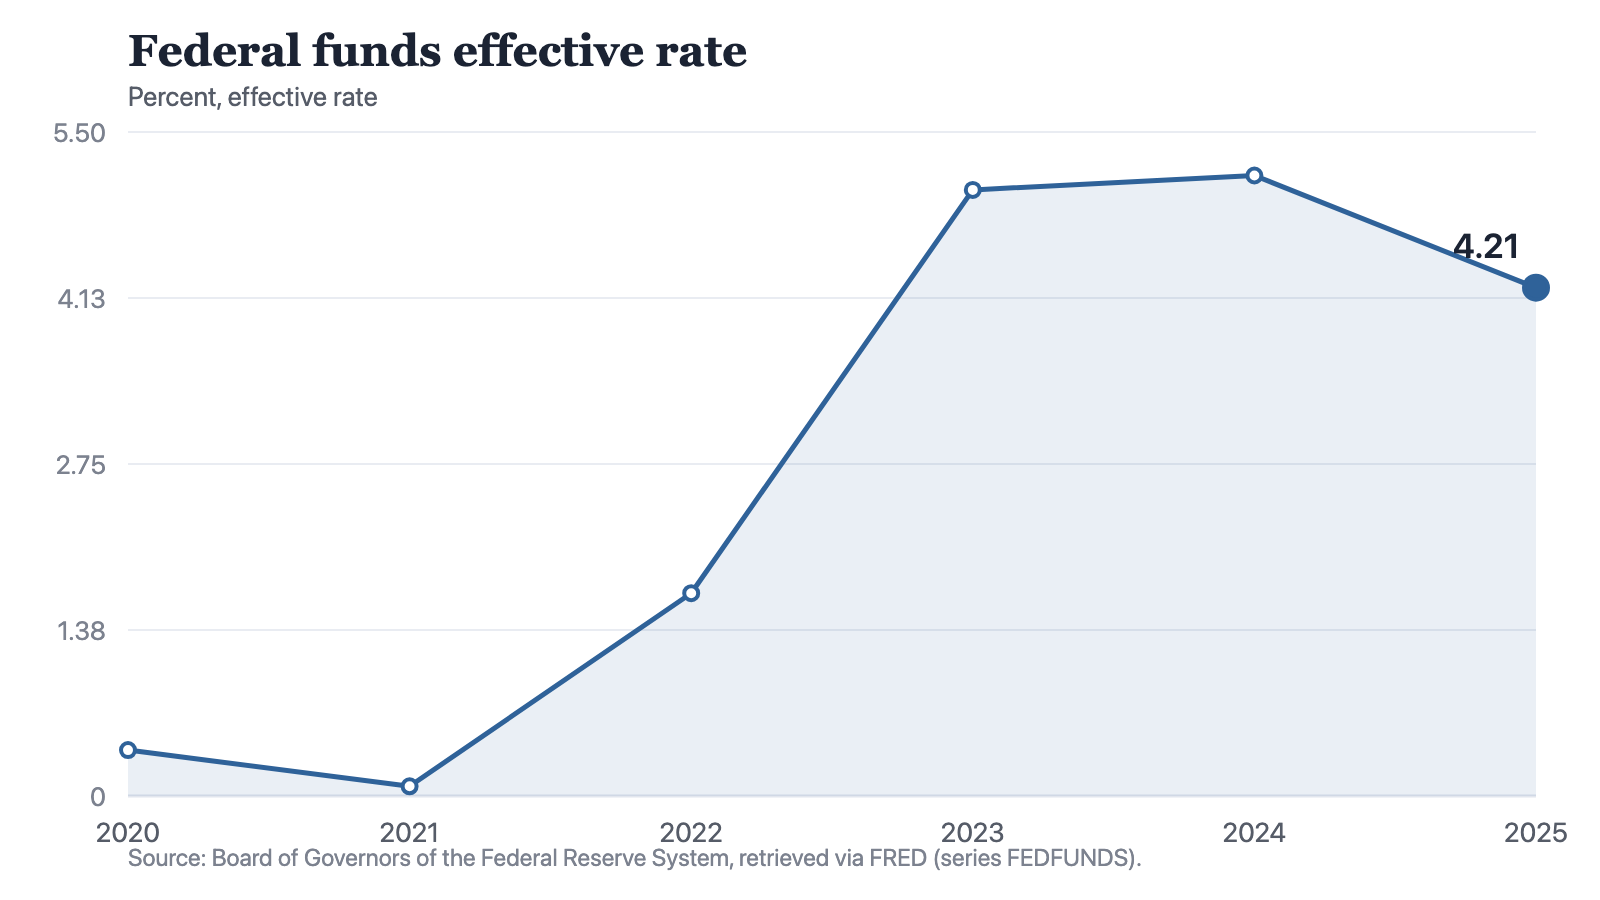
Notes: Annual averages smooth every move made within the year. The 2025 observation averages the months available at retrieval and is not a full-year figure.
Source: The Cefa Brief
Chart description
A line chart showing the federal funds effective rate at 0.38 percent in 2020, falling to 0.08 in 2021, then rising to 1.68 in 2022 and 5.02 in 2023. It rises again slightly to 5.14 in 2024, the highest reading in the window, before easing to 4.21 in 2025. The visual impression is a long flat base, a near-vertical rise across two observations, a plateau, and a modest step down.
A line chart showing the federal funds effective rate at 0.38 percent in 2020, falling to 0.08 in 2021, then rising to 1.68 in 2022 and 5.02 in 2023. It rises again slightly to 5.14 in 2024, the highest reading in the window, before easing to 4.21 in 2025. The visual impression is a long flat base, a near-vertical rise across two observations, a plateau, and a modest step down.
What followed the climb was not a peak but a plateau. The move from 2023 to 2024 is 0.12 points, the smallest change anywhere in the window, including the small decline from 2020 to 2021. Two consecutive years averaged above five percent.
Then one step down, to 4.21 percent. It is a real move and the largest single-year fall in the window. It is also smaller than either of the two upward steps that built the plateau.
Across six observations this series records exactly two downward moves. One is the 0.30-point step from 2020 to 2021, which took the average to its floor of 0.08 percent. The other is the step just described. Everything in between is upward, and two of those upward steps are individually larger than both declines combined.
Where 4.21 percent sits against its own history
The 2025 average is below the two years that preceded it and above every year before those. It is more than double the 2022 average of 1.68 percent, and it is above the 2020 average of 0.38 percent by 3.83 points. On this series, the current policy rate is not a return toward the earlier regime. It is the third-highest reading of the six.
The distance still to travel, if travelling back is the point, is 2.53 percentage points, being the gap between the 2025 average and the 2022 average of 1.68 percent. That gap is more than two and a half times the size of the only decline this series has recorded since the peak. Stating it that way is arithmetic on published values rather than a forecast, and it is the fairest summary of where the policy rate stands relative to the period it is often said to be returning to.
That distinction is the whole finding. A rate that has fallen and a rate that has normalised are different objects, and only one of them changes what a project can afford to borrow. Anyone who set a hurdle rate in 2021 and is revisiting it because rates are falling is revisiting it against a number still far above the one they started with.
What this series cannot tell you
An annual average is a blunt instrument, and it should be read as one. It conceals the timing of every move inside the year: a rate that was cut in January and a rate that was cut in November can produce similar annual averages and entirely different conditions for anyone trying to close a financing. The series says where the year sat, not when.
It also says nothing about direction from here. Five annual changes are not a trend, and the largest of them is already behind the window's midpoint. Nothing in these six observations licenses a claim about 2026.
What the six observations do license is a correction to the framing. The overnight rate has come down once, by 0.93 points, from a plateau it held for two years. Against a climb of 5.06 points, that is the beginning of a descent, not the substance of one, and any plan built on the assumption that the cost of money is reverting is assuming something this series has not yet shown.
Method and data
The figures are annual averages of the federal funds effective rate, published by the Board of Governors of the Federal Reserve System and redistributed by FRED, retrieved for this site on 19 September 2026.
They are not month-end or year-end readings, and they are not the target range. An annual average smooths every move made inside the year, so the peak and trough shown here are lower and higher respectively than the extremes the market actually saw.
The 2025 observation is an average of the months available at retrieval. It is not a full-year figure and should not be read as one.
All differences quoted are arithmetic differences between the published annual averages. No figure here is estimated, projected or adjusted.
How to cite
Jag DeSaint, "The policy rate has given back less than a fifth of its climb," The Cefa Brief, Applied America, 10 de setembro de 2026, https://applied.thecefa.org/cefa-brief/policy-rate-gave-back-a-fifth.
About the author

Each author told us that for this piece they hold no interest a reader would think relevant.
This Insights piece carries its author's name because the view in it is the author's own. An editor reviewed it before publication, which is not the same as agreeing with it. It is not a position of the Center for Economics & Foreign Affairs or of Applied America.
© 2026. The author or authors hold the copyright in this Insights piece; CEFA publishes it with their permission. This edition, its editing and its presentation are © 2026 Center for Economics & Foreign Affairs. To republish it, see our republication terms. Republishing
Share
The Cefa Brief · applied.thecefa.org/cefa-brief/policy-rate-gave-back-a-fifth · Printed from the web edition