
Factory construction spending fell in 2025 after four straight years of increase
The monthly average rose from 75 billion dollars in 2020 to 244 billion in 2024, then fell to 215 billion in 2025, the only fall in six readings. Nonresidential construction spending, from the same agency and on the same basis, rose in that same year.
by
Published Corrected 2 minute read

Ilustração: The Cefa Brief
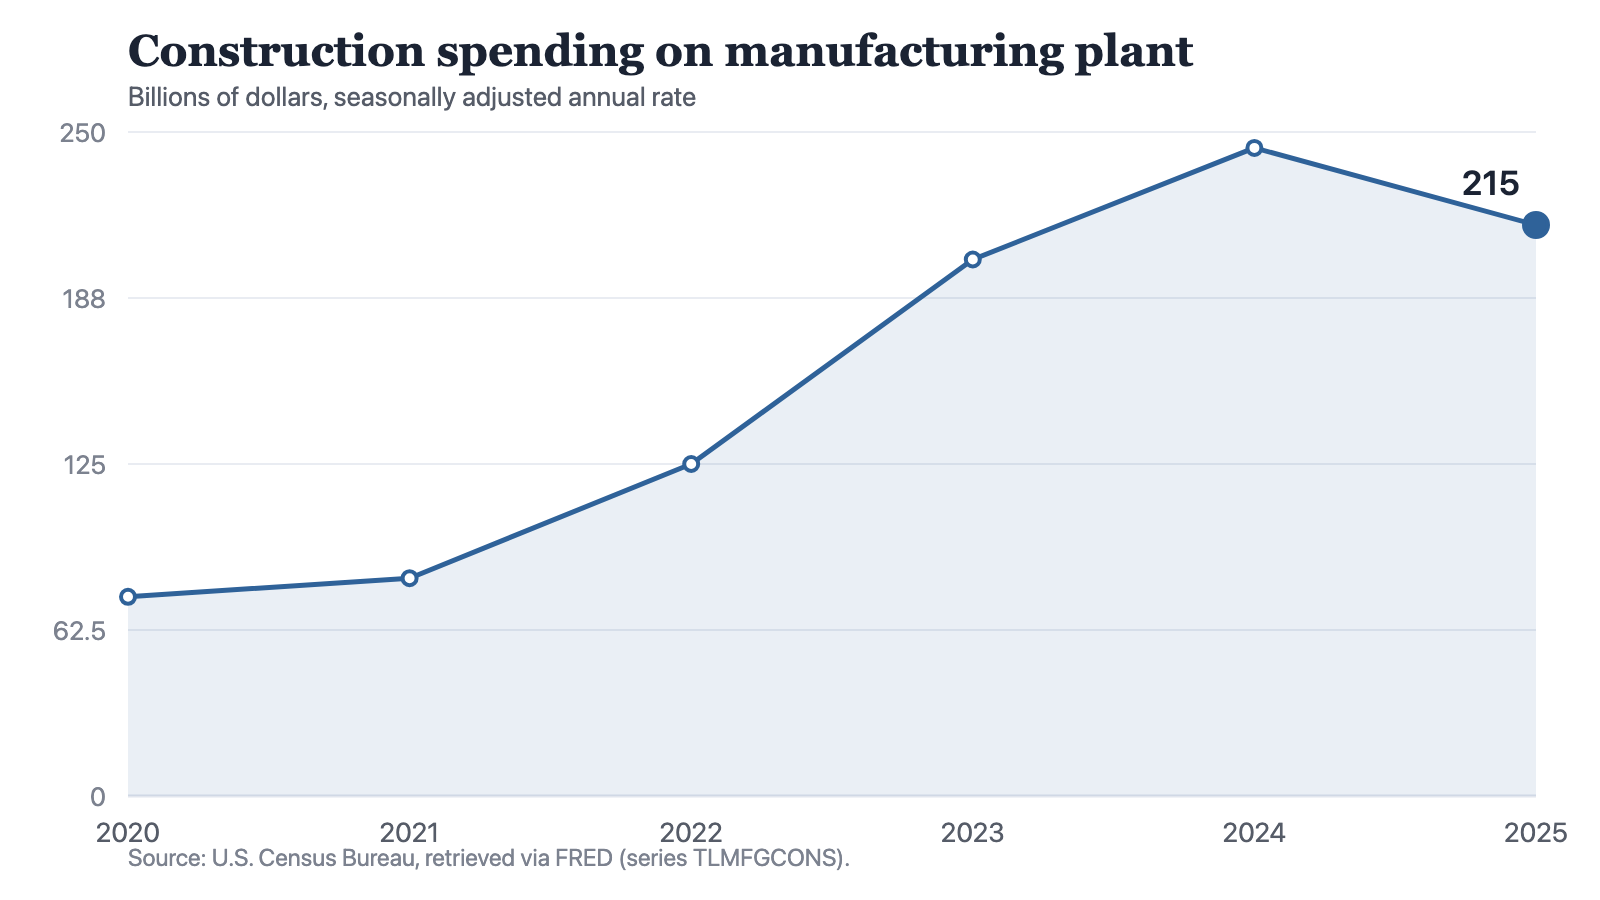
Spending on manufacturing plant fell in 2025. The annual rate was 244 billion dollars in 2024 and 215 billion in 2025, a fall of 29 billion. That is the only fall among the five year-on-year steps the series holds. The four steps before it were all increases, and together they added 169 billion.
The six readings are 75 billion dollars in 2020, 82 in 2021, 125 in 2022, 202 in 2023, 244 in 2024 and 215 in 2025. Each is a yearly rate rather than a single month's spending. The steps are 7 billion, then 43, then 77, then 42, and then minus 29. The series climbed fastest into 2023 and turned in 2025.
Notes: Annual observations. Each point is a yearly rate, not a single month’s spending.
Source: The Cefa Brief
Chart description
A line chart of construction spending on manufacturing plant, at a seasonally adjusted annual rate in billions of dollars: 75 in 2020, 82 in 2021, 125 in 2022, 202 in 2023, 244 in 2024 and 215 in 2025. The line rises at every step up to 2024, most steeply between 2022 and 2023, then falls in 2025 to a level that is still above every reading before 2024.
A line chart of construction spending on manufacturing plant, at a seasonally adjusted annual rate in billions of dollars: 75 in 2020, 82 in 2021, 125 in 2022, 202 in 2023, 244 in 2024 and 215 in 2025. The line rises at every step up to 2024, most steeply between 2022 and 2023, then falls in 2025 to a level that is still above every reading before 2024.
The fall does not extend to the wider measure
Nonresidential construction spending comes from the same agency and is stated on the same seasonally adjusted annual-rate basis. It reads 856 billion dollars in 2020, 845 in 2021, 968 in 2022, 1,193 in 2023, 1,295 in 2024 and 1,309 in 2025. It rose in 2025. The 29 billion the plant series gave up is larger than the 14 billion the wider series gained. The wider series has a down year of its own, 2021, when it fell by 11 billion while plant spending rose by 7.
Dollars, not buildings
The series is stated in dollars and is not adjusted for the cost of construction. A rise can mean more plant put in place, or the same plant put in place at a higher price. The series does not separate the two, and the same holds for the fall. Twenty-nine billion fewer dollars is not by itself 29 billion less building, and nothing here converts these figures into constant prices.
Two further limits sit in the measure itself. Each point is a yearly rate, so reading 215 billion dollars as a single month's spending on factories would be wrong by roughly a factor of twelve. And the series counts the value of construction put in place on manufacturing structures, which is not the machinery installed inside them, the people who will work in them, or what they produce; nor does it say which industries or which states the money went to.
What would change the answer
One down year is one down year. At 215 billion the annual rate is still the second-highest of the six readings, 13 billion above 2023 and 140 billion above 2020, so the level has not returned to where the run started. Whether 2025 is a turn or a pause is a question the next reading answers and this one cannot. The series records dollars put in place. It gives no reason for the climb and none for the fall, and no figure in it identifies a cause.
Updates and corrections
Correction ·
Corrected 19 September 2026. An earlier version of this piece described construction spending as a monthly average. The Census Bureau publishes these series at a seasonally adjusted annual rate, so each figure states a yearly rate of spending rather than one month's outlay. Every figure, difference and comparison in the piece is unchanged; what was wrong was the description of what the figures measure. The chart has been redrawn with the corrected unit.
Correction ·
Corrected 19 September 2026. An earlier version added that reading a figure as a single month's would understate it by roughly a factor of twelve. That had the relationship the wrong way round: the figure is already stated at a yearly rate, so reading it as one month's overstates that month. The sentence has been removed rather than reversed, because the method note already says plainly that each point is a yearly rate and approximates the year. No figure in the piece has changed.
Method and data
The figures are annual observations of total construction spending on manufacturing structures, series TLMFGCONS, published by the U.S. Census Bureau, redistributed by FRED and retrieved for this site on 19 September 2026. The unit is billions of dollars at a seasonally adjusted annual rate: the Census Bureau states each monthly observation at a yearly rate, so each annual point is itself a yearly rate and approximates the year's own spending. The figures are in current dollars with no adjustment for construction costs, so a change in the series does not separate how much was built from what building cost. The series measures the value of construction put in place on manufacturing structures and nothing else: not the equipment installed, not employment, not output, and not the industry, state or owner behind the spending. The nonresidential construction series quoted in the text, TLNRESCONS, is a separate series from the same agency stated on the same seasonally adjusted annual-rate basis; it is named for contrast, and nothing here divides one series by the other.
How to cite
Jag DeSaint, "Factory construction spending fell in 2025 after four straight years of increase," The Cefa Brief, Applied America, 12 de março de 2025, https://applied.thecefa.org/cefa-brief/only-plant-spending-turned-down. Updated 19 de setembro de 2026.
About the author

Each author told us that for this piece they hold no interest a reader would think relevant.
This Insights piece carries its author's name because the view in it is the author's own. An editor reviewed it before publication, which is not the same as agreeing with it. It is not a position of the Center for Economics & Foreign Affairs or of Applied America.
© 2025. The author or authors hold the copyright in this Insights piece; CEFA publishes it with their permission. This edition, its editing and its presentation are © 2025 Center for Economics & Foreign Affairs. To republish it, see our republication terms. Republishing
Share
The Cefa Brief · applied.thecefa.org/cefa-brief/only-plant-spending-turned-down · Printed from the web edition