
Ohio levies a corporate income tax and collected 176 thousand dollars from it
In the FY2025 collections file the corporate income tax runs from 32.9 percent of New Hampshire's state taxes to effectively nothing in Ohio, and four states have no such levy at all. The share is a poor guide to how a state treats capital, and it is used as a good one.
by
Vantage point
I write from the editor's desk of this brief, and my only view of these tax systems is the same public collections file any reader can download.
Published 7 minute read

Ilustração: The Cefa Brief
Ohio raised 38,844,122 thousand dollars in state taxes in fiscal year 2025. Against the line for corporation net income tax, the Census file records 176 thousand dollars. Not 176 million. One hundred and seventy-six thousand dollars, which is 0.0005 percent of what the state collected, and which the same file pairs with a flag marking Ohio as a state that levies a corporation net income tax.
I have no explanation for that number and I am not going to invent one. The file records collections, not statutes; it says what arrived, not why. What the figure is good for is destroying a habit, and the habit is worth destroying because it is so widespread: reading a state's corporate income tax share as a statement about how that state treats capital. The share is the first number anyone reaches for when comparing states on business taxation, it is federally sourced and available for all 51 jurisdictions, and it is not fit for the purpose it is most often put to.
The range is the whole argument
Across the 47 jurisdictions that record a corporation net income tax line, the share of total state tax collections runs from effectively zero to 32.9 percent. New Hampshire sits at the top: 1,110,991 thousand dollars of corporate income tax out of 3,372,460 thousand collected, which is very nearly a third of the state's own tax revenue from one levy on one kind of income. Alaska is at 21.7 percent, New York 20.4, Illinois 17.4. The median of the 47 is 9.2 percent.
At the bottom, South Dakota records 2.2 percent, Indiana 3.3, Hawaii 3.7, North Carolina 3.9, and Ohio the figure I began with. Four states - Nevada, Texas, Washington and Wyoming - record no corporation net income tax at all, which the file states as a fact about those states rather than as a missing value, through a flag and a named list. That distinction is doing real work: a zero and an absence would look the same in a spreadsheet and mean entirely different things about a state.
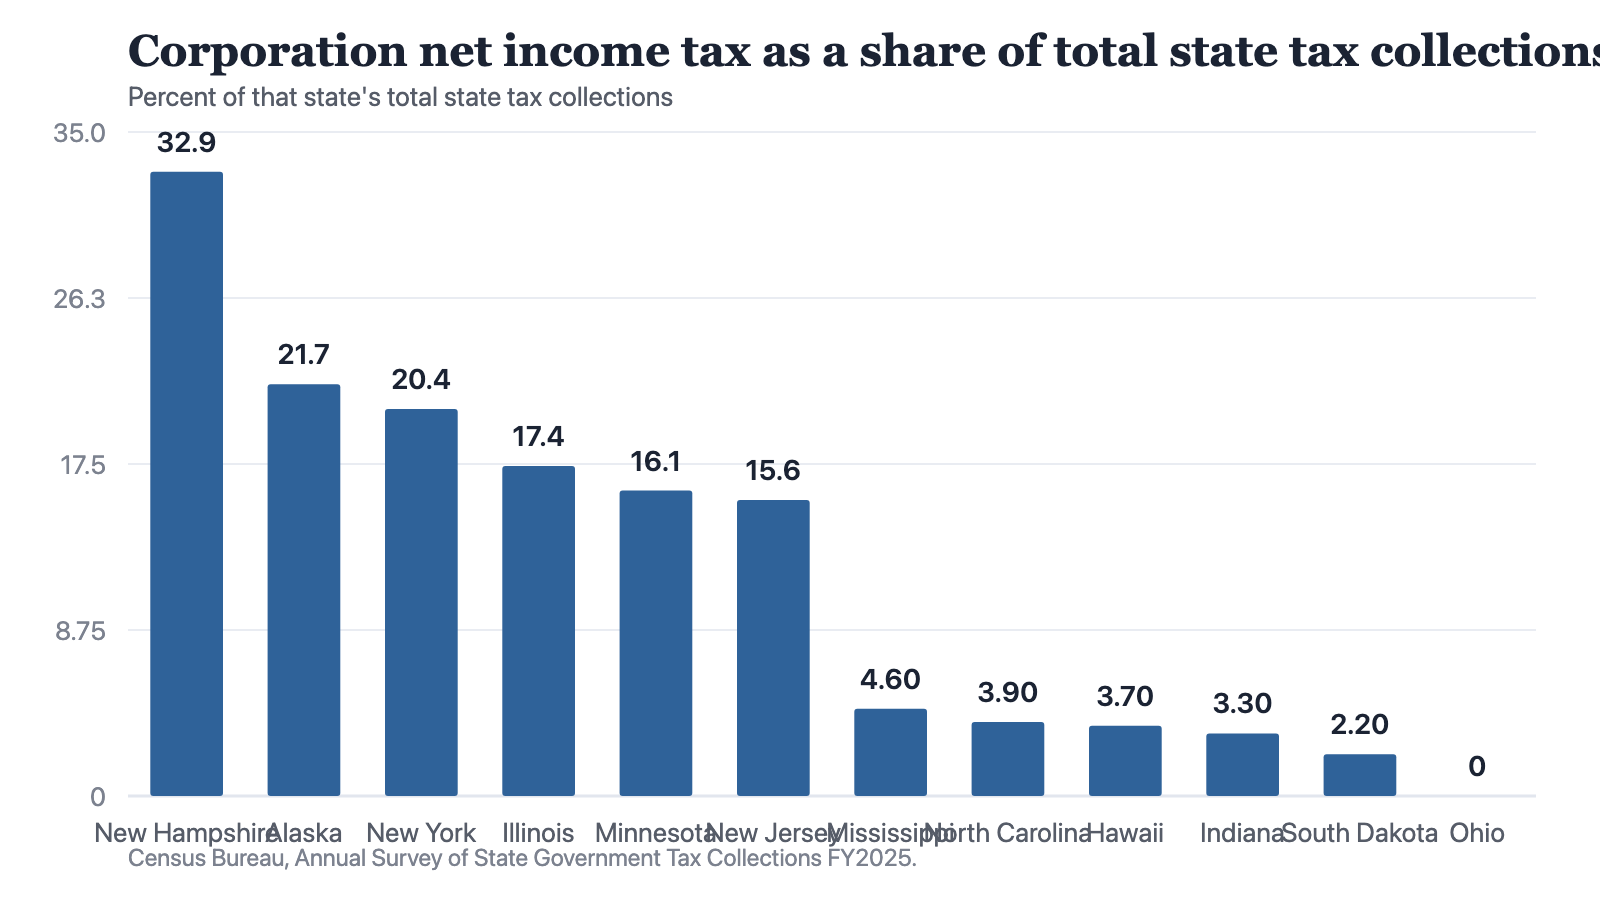
Notes: Census Bureau, Annual Survey of State Government Tax Collections FY2025. State-level collections only. Nevada, Texas, Washington and Wyoming are absent because they levy no corporation net income tax. The median of the 47 is 9.2 percent.
Source: The Cefa Brief
Chart description
Twelve bars in descending order. New Hampshire 32.9 percent, Alaska 21.7, New York 20.4, Illinois 17.4, Minnesota 16.1, New Jersey 15.6; then Mississippi 4.6, North Carolina 3.9, Hawaii 3.7, Indiana 3.3, South Dakota 2.2, Ohio 0.0. The 35 jurisdictions between the two groups are omitted from the chart. New Hampshire's share is about fifteen times South Dakota's, and the Ohio bar is not visible at this scale.
Twelve bars in descending order. New Hampshire 32.9 percent, Alaska 21.7, New York 20.4, Illinois 17.4, Minnesota 16.1, New Jersey 15.6; then Mississippi 4.6, North Carolina 3.9, Hawaii 3.7, Indiana 3.3, South Dakota 2.2, Ohio 0.0. The 35 jurisdictions between the two groups are omitted from the chart. New Hampshire's share is about fifteen times South Dakota's, and the Ohio bar is not visible at this scale.
Now try to make that range mean something. The four states with no corporate income tax are usually described as the business-friendly end of the distribution, and New Hampshire, with a third of its revenue from the levy, as the other end. But New Hampshire raises 2,393 dollars per resident in state taxes, which is the second-lowest figure of the 51 jurisdictions, while Ohio, whose corporate line collects nothing worth counting, raises 3,269 dollars per resident. On a share of collections the two states look like opposites. On the total taken out of the economy per head, the state with the heavy corporate tax takes less.
That is not a paradox. It is what happens when you use a ratio as a level. A share tells you the composition of a state's revenue. It cannot tell you the size of it, and composition without size is not a description of anything a business would experience.
The point holds in the other direction too, and less comfortably. New York collects 20.4 percent of its state taxes from corporate income. California collects 14.3 percent - a lower share, from the largest corporate income tax collection in the file, 39,423,090 thousand dollars. Whichever of those two states you think is heavier on business, the share does not settle it and was never capable of settling it.
What the share cannot see
There is a second problem, more serious, and the file is candid about it. It carries five named levies and each state's total, and the five do not add up to the total. In Ohio the five named items account for 71.0 percent of collections. In New Hampshire, 47.9 percent. More than half of what New Hampshire raises sits in parts of the Census schedule this dataset does not carry.
So when Ohio's corporate line reads 176 thousand dollars, the correct inference is not that Ohio does not tax business. It is that whatever Ohio does to business, if anything, is either in the 29 percent of collections outside these five items or is not a state tax at all. The file cannot tell me which, and neither can anyone reading it.
A share tells you the composition of a state's revenue. It cannot tell you the size of it, and composition without size describes nothing a business would ever experience.
The same caution runs the other way. Washington levies no corporation net income tax, and raises 59.4 percent of its state taxes from general sales and gross receipts, a structure that reaches business activity by a route this file's corporate column cannot see. Washington also records an individual income tax line of 545,712 thousand dollars, which will surprise anyone who has filed the state under the wrong shorthand.
Why anyone should care about the composition at all
Having spent four paragraphs on what the share cannot do, let me say what I think it can. Composition is a statement about volatility and about who bears the variance.
Corporate net income is the most cyclical of the major bases. Sales collections move with consumption, income tax collections move with employment and wages, and corporate collections move with profit, which is a residual of everything else and therefore swings hardest. A state raising 32.9 percent of its own taxes from that base has made a different bet from a state raising 2.2 percent, whatever the total burden in either place.
For a long-dated commitment that matters more than the level does. A concession, an availability payment or any obligation running past the next cycle is a claim on a government's revenue in years nobody has seen. What you want to know about that government is not how much it collects in a good year but which of its bases go first in a bad one, and how much of the budget rides on them. Composition answers half of that question. New Hampshire's answer is that a third of its own tax revenue rides on corporate profit.
I cannot demonstrate that from this file. There is one year of collections here and no history, so the volatility claim is reasoning about how the bases work, not a finding I have measured. I flag the difference because the distinction between the two is the whole discipline: the composition is in the data, the consequence is an argument, and a reader is entitled to know which of the two I am handing them.
The objection, and what survives it
The obvious objection is that none of this is news to a tax practitioner. Everyone who works on state taxes knows that collections are not rates, that the Census categories are coarse, and that Ohio's corporate line is not the story of business taxation in Ohio. Writing a piece to say so is arguing with a strawman.
I would accept that if the misreading stayed among practitioners. It does not. The share of collections by levy is exactly the kind of figure that travels: it is public, it is comparable across all 51 jurisdictions, it sorts neatly into a ranked list, and it arrives with a federal agency's name attached. It ends up in site-selection material, in competitiveness indices, and in the arguments states make about each other, almost always as a claim about burden rather than composition. A number does not have to be obscure to be misused. It has to be available.
What survives the objection is a short list of things this file will actually support. It will tell you which levies a state uses and which it does not, and the absences are recorded as facts rather than blanks. It will tell you the composition of the named part of the base, which is a statement about where a budget is exposed. Joined to population, it will tell you the level of state-level collection per head. It will not tell you a rate, a burden, an effective tax on any firm, or what a state does instead of the thing it does not do. None of that is a small list. It is a considerably better basis for a conversation with a state than a ranked table of one levy, and every item on it is checkable by a reader in an afternoon. What it requires is giving up the single comparable number, which is the thing everybody actually wants and the one thing this file cannot honestly provide.
The 176 thousand dollars is worth keeping in mind for the same reason a broken instrument is worth keeping on the bench. It is a reminder that a column can be filled in, federally sourced, precisely stated and still not answer the question it is being asked. Ohio levies a corporate income tax. The line says 176 thousand dollars. Both of those are facts from the same file, they are not in tension, and anyone who can hold them together at once is reading it correctly. Anyone who reports only the second has written a true sentence that misleads, which is the harder kind to catch.
How to cite
Jag DeSaint, "Ohio levies a corporate income tax and collected 176 thousand dollars from it," The Cefa Brief, Applied America, 25 de setembro de 2025, https://applied.thecefa.org/cefa-brief/ohio-collected-176-thousand-dollars.
About the author

Each author told us that for this piece they hold no interest a reader would think relevant.
This Perspectives piece carries its author's name because the view in it is the author's own. An editor reviewed it before publication, which is not the same as agreeing with it. It is not a position of the Center for Economics & Foreign Affairs or of Applied America.
© 2025. The author or authors hold the copyright in this Perspectives piece; CEFA publishes it with their permission. This edition, its editing and its presentation are © 2025 Center for Economics & Foreign Affairs. To republish it, see our republication terms. Republishing
Share
The Cefa Brief · applied.thecefa.org/cefa-brief/ohio-collected-176-thousand-dollars · Printed from the web edition