
How construction spending counts work that has actually been done
Announcements, permits and starts all measure intent. Value put in place measures work installed on site. This explains what the difference is worth when a building programme is being judged.
Prepared by
Last reviewed Published 3 minute read

Ilustração: The Cefa Brief
When a factory, a transmission line or a housing block is announced, four different measures will follow it, and only the last of them reports work that has actually happened. An announcement is a statement of intent. A building permit is a legal authorisation to begin. A start is the moment ground is broken. Value put in place is an estimate of the construction work installed on site during the period, whether or not it has been paid for and whether or not the project will ever be finished.
The Census Bureau builds that estimate from a sample of projects and a schedule of how construction value accrues across a project's life. A plant that takes three years to build enters the series in pieces across those three years, not as a lump at the ribbon-cutting. That is what makes it an activity measure rather than an event measure. It tracks the pace of work, and it turns down when work slows even though nothing has been cancelled.
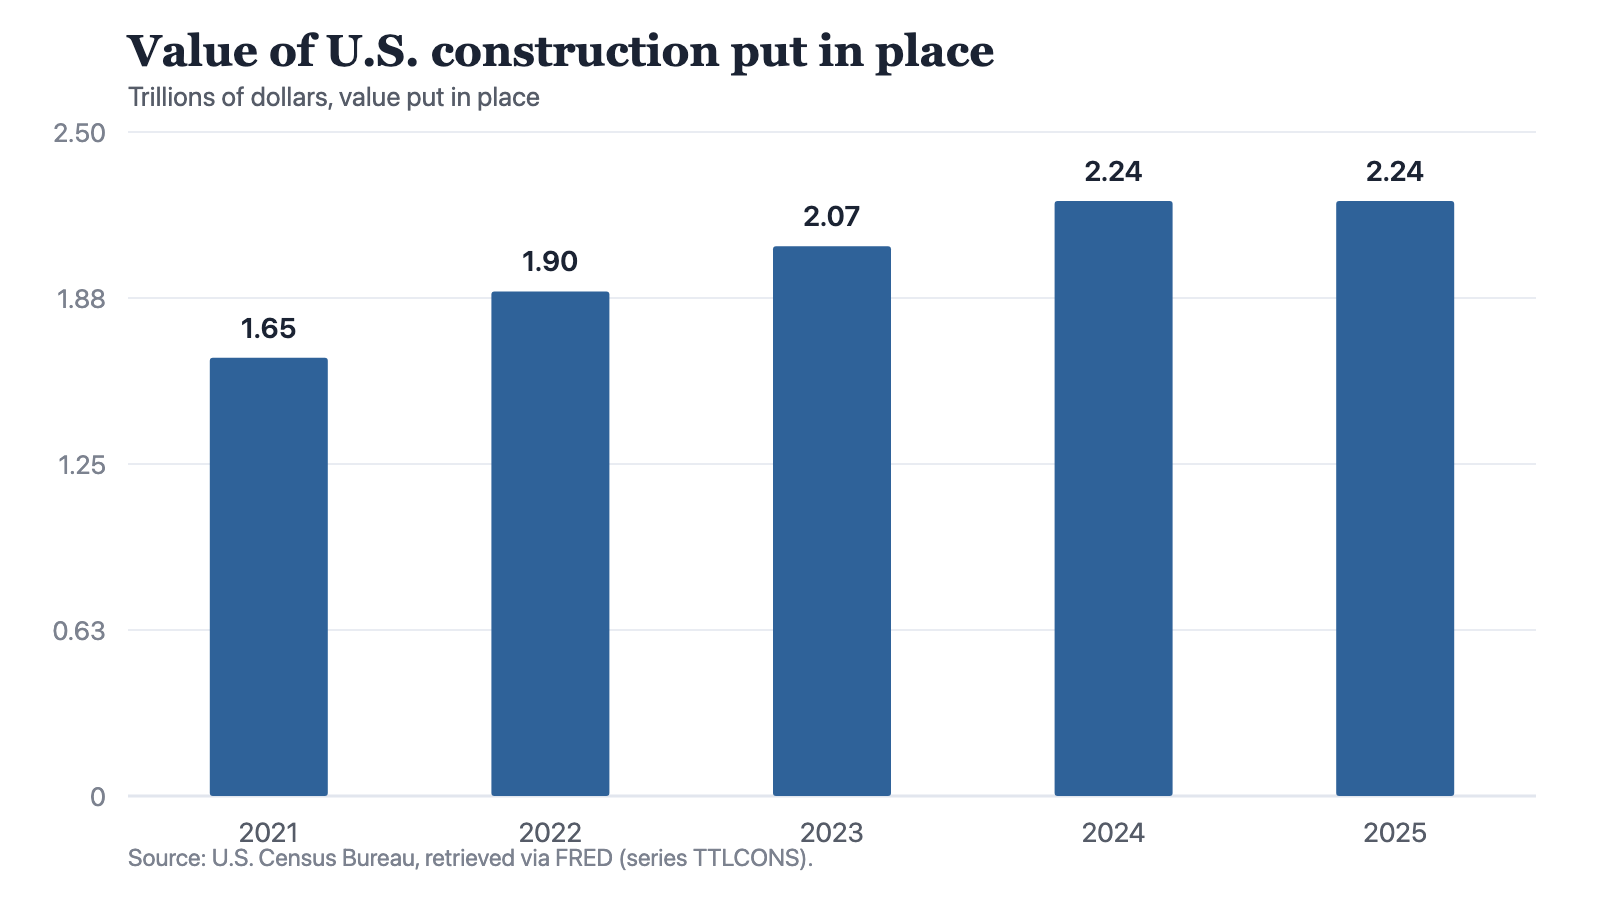
Notes: Source: U.S. Census Bureau, retrieved via FRED (series TTLCONS). The estimate covers private and public construction together and is not adjusted for construction costs.
Source: The Cefa Brief
Chart description
Five bars, one for each year from 2021 to 2025, read left to right. The first bar stands at 1.65 trillion dollars. Each of the next three is taller than the one before it: 1.9 trillion in 2022, 2.07 trillion in 2023 and 2.24 trillion in 2024. The rise is steepest between 2021 and 2022 and flattens with each further step. The fifth bar, 2025, is the same height as the fourth at 2.24 trillion, so the chart ends on a plateau rather than a further climb. Every figure is stated in the prices of the year it describes.
Five bars, one for each year from 2021 to 2025, read left to right. The first bar stands at 1.65 trillion dollars. Each of the next three is taller than the one before it: 1.9 trillion in 2022, 2.07 trillion in 2023 and 2.24 trillion in 2024. The rise is steepest between 2021 and 2022 and flattens with each further step. The fifth bar, 2025, is the same height as the fourth at 2.24 trillion, so the chart ends on a plateau rather than a further climb. Every figure is stated in the prices of the year it describes.
What the series is counting in
The figures are current-dollar. A year in which the same volume of concrete, steel and site labour costs more will record a higher value put in place than the year before, with no more building done. Construction costs are volatile, because materials and site labour both move and often move together, so the gap between the dollar series and the physical volume of work can be wide and can persist for years. The series carries no deflator of its own. Anyone who wants the volume has to bring a construction cost index to it.
That is the first thing to understand about a flat stretch in the line. Value put in place holding steady from one year to the next means the dollar value of work installed did not change. Whether the physical amount of work rose, fell or held depends entirely on what happened to costs over the same period, and this series does not say.
Private and public construction are different animals
The total splits into private and public construction, and the two respond to different pressures. Private construction follows credit conditions, rents and expected demand, and it turns when financing gets dearer. Public construction follows appropriations and the pace at which agencies can obligate and then spend them, which lags the legislation by years. A national total moving sideways can conceal one half rising while the other falls, which is why the published breakdown usually matters more than the headline for a policy question.
What the measure does not tell you
- Whether a project will be completed. The series records work done to date, and a halted project simply stops contributing to it.
- What was built. A dollar of data centre and a dollar of school enter the same total; only the detailed tables separate them.
- Who paid. The measure follows the work rather than the financing, so a project supported by a federal credit programme and one funded from retained earnings look identical here.
- Whether capacity followed. A semiconductor plant counts as construction until the day it is equipped, and the tools inside it are counted elsewhere, as equipment investment.
The last of those is where readers most often go wrong. A large construction figure during a factory-building programme confirms that buildings are going up. It does not confirm that anything is being produced inside them, and the lag between the two is measured in years, not quarters. The two questions have separate measures and have to be asked separately.
Announcements can be withdrawn and permits can expire. Work put in place has already happened.
So when a figure is offered as evidence that a building programme is working, establish which of the four it is. If it is an announcement or a permit, it is a forecast of somebody's intention and can be unwound at no cost to the person who made it. If it is value put in place, it is a record of work installed, stated in that year's dollars, and the next question is what those dollars bought, which needs a cost index the series does not carry.
About the author
Each author told us that for this piece they hold no interest a reader would think relevant.
Explainers are written and kept up to date by The Cefa Brief’s editors. An Explainer is background CEFA stands behind. It is not one author’s argument, and it is not a CEFA position on what anyone should do. If something here is wrong or out of date, write to applied@thecefa.org.
© 2025 Center for Economics & Foreign Affairs. To republish it, see our republication terms. Republishing
Share
The Cefa Brief · applied.thecefa.org/cefa-brief/construction-value-put-in-place · Printed from the web edition