
The dollar index gained 7.6 points in one year and 2.0 in the three that followed
The broad index fell to 113.1 in 2021, rose to 120.7 in 2022, and has since read 120.3, 122.9 and 122.7. Each annual point is the average of that year's observations, so a flat line between two years does not establish a quiet year inside either of them.
by
Published 3 minute read

Ilustração: The Cefa Brief
In 2025 the broad dollar index averaged 122.7. That is 4.9 index points above where this window opens in 2020, and the single step into 2022 is larger than the whole of that net change. Between 2021 and 2022 the index rose 7.6 points, from 113.1 to 120.7. Across the three years since it has added 2.0.
The six annual readings are 117.8 in 2020, 113.1 in 2021, 120.7 in 2022, 120.3 in 2023, 122.9 in 2024 and 122.7 in 2025. Each is the average of that year's observations and not a reading taken on any particular date. The high of the window is 122.9 in 2024 and the low is 113.1 in 2021, so the latest figure sits 0.2 below the high and 9.6 above the low.
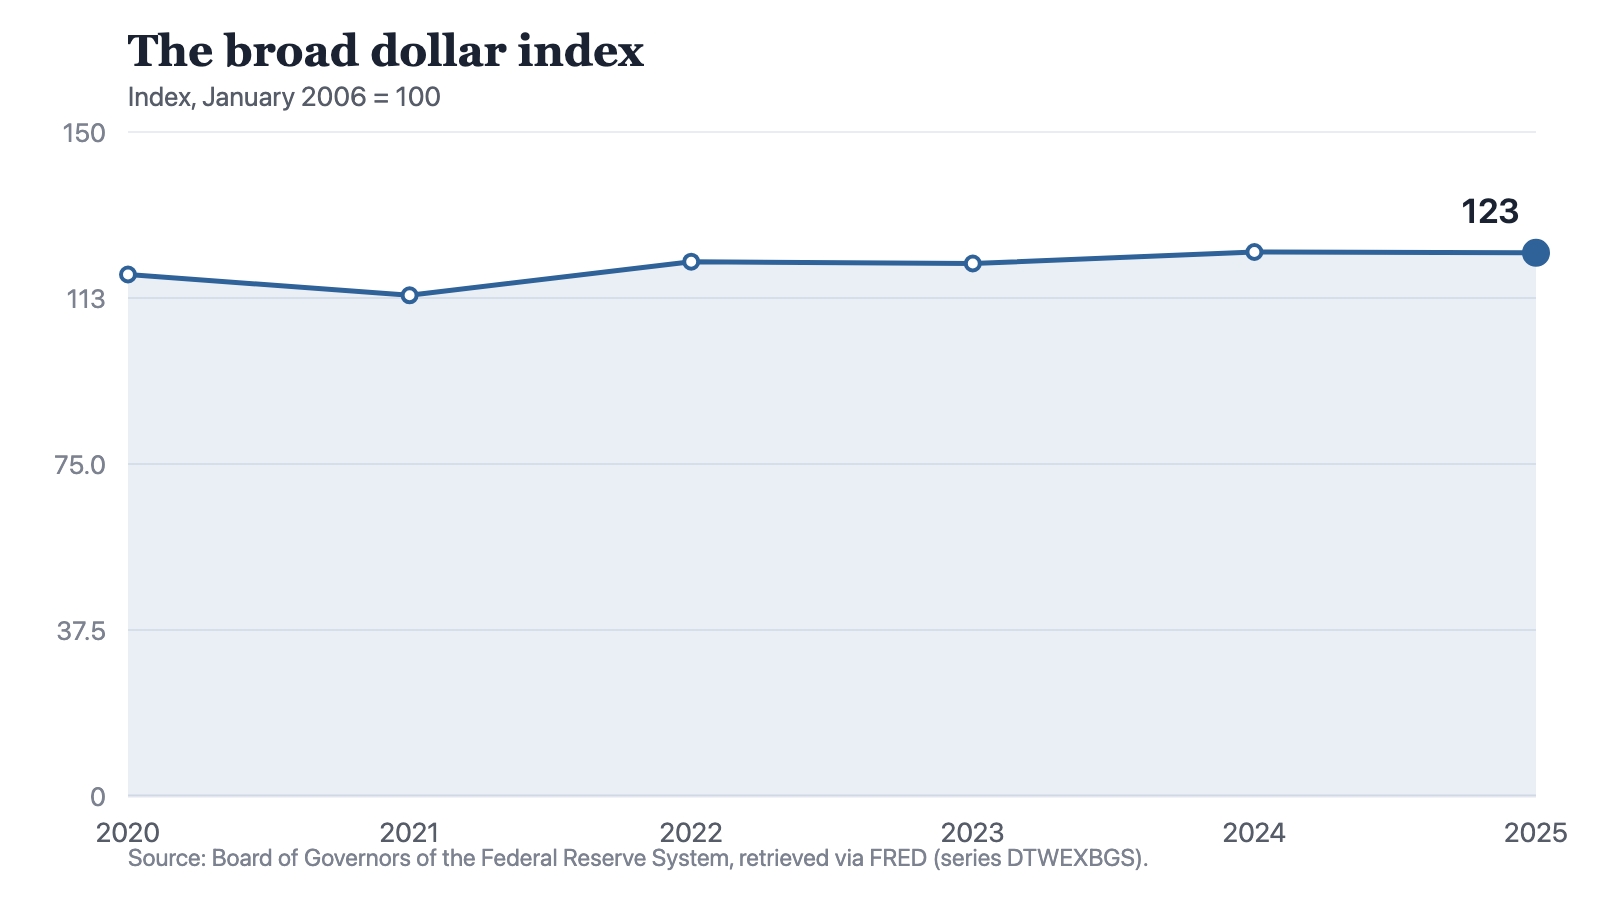
Notes: Annual observations. Each point is the average of that year's observations rather than a value on a single date, and the index measures the dollar against a basket of partner currencies rather than against any one of them.
Source: The Cefa Brief
Chart description
A line chart of the broad dollar index, with January 2006 set to 100: 117.8 in 2020, 113.1 in 2021, 120.7 in 2022, 120.3 in 2023, 122.9 in 2024 and 122.7 in 2025. The line dips once at the start, climbs steeply into 2022, and then runs almost level across its last four readings.
A line chart of the broad dollar index, with January 2006 set to 100: 117.8 in 2020, 113.1 in 2021, 120.7 in 2022, 120.3 in 2023, 122.9 in 2024 and 122.7 in 2025. The line dips once at the start, climbs steeply into 2022, and then runs almost level across its last four readings.
The steps, not the level
Year on year the index moved 4.7 points down, then 7.6 up, then 0.4 down, then 2.6 up, then 0.2 down. The largest of those five steps is the second and the smallest is the last. The four readings from 2022 onward sit inside a band of 2.6 points, which is narrower than the 4.7-point fall the series recorded between 2020 and 2021.
A level and a direction are different facts. Read as a level, the index has been near the top of its six-year range since 2022, and 2025 is the second-highest reading in the window. Read as a direction, little has happened since 2022: two of the three steps after that year are falls, and the net result is 2.0 points up across three years.
The year the rate moved most
The federal funds effective rate over the same six years reads 0.38 percent in 2020, 0.08 in 2021, 1.68 in 2022, 5.02 in 2023, 5.14 in 2024 and 4.21 in 2025. Its largest single-year rise is the 3.34 points between 2022 and 2023. In that same year the dollar index fell, by 0.4 points. The dollar's own largest rise, the 7.6 points into 2022, landed in a year the policy rate rose by 1.60, less than half the increase that followed it.
Two separate series are placed beside each other here and neither is divided by the other. A policy rate is one of several things that bear on a currency, and six annual averages cannot separate them. What the pairing establishes is narrower and still worth holding: the years do not line up. The dollar made its move before the rate made its largest one, and it stayed inside a 2.6-point band while the rate rose 3.34, then 0.12, then gave back 0.93.
One year did the work. The readings since sit inside a band of 2.6 index points, and a band is a condition to plan around rather than a trend to extend.
What six averages cannot tell you
Each point here is a year's average. The series is requested from FRED as annual observations using the average aggregation, so 122.7 describes the typical level through 2025 rather than its value on any given day. Two years whose averages differ by 0.2 may both have been quiet, or both turbulent in ways that cancelled. These six numbers cannot distinguish those cases, and anyone who needs the path inside a year needs the underlying observations instead.
A broad index is a basket. It measures the dollar against a group of partner currencies at once, so it carries no statement about the dollar against any single one of them. A reader who needs the euro, the yen or the peso needs a bilateral series, and this is not one. The index is stated relative to January 2006, which is set to 100, and it makes no adjustment for differences in price levels between countries.
The defensible sentence is short and dull. The broad dollar index rose 7.6 points into 2022, has added 2.0 in the three years since, and has not left a 2.6-point band in that time. Whether the next reading leaves the band is not in these six numbers. An argument that assumes the dollar is still climbing assumes something this series does not show, and an argument that assumes it is falling back does the same in the other direction.
Method and data
The figures are annual observations of the broad dollar index, series DTWEXBGS, published by the Board of Governors of the Federal Reserve System, redistributed by FRED and retrieved for this site on 19 September 2026. The unit is an index with January 2006 set to 100, so a reading carries no currency of its own and only states the dollar's standing against a basket of partner currencies relative to that base month. The annual points are requested from FRED with the average aggregation, which means each one is the average of that year's observations rather than a value on a particular date, and a year's figure can conceal movement within the year. Because the index is a basket it says nothing about the dollar against any single currency, and because it makes no adjustment for differences in price levels between countries it is not a real exchange rate; nothing in this piece converts it into one. The federal funds effective rate quoted in the text is a separate series from the same agency, named for context only, and no figure here is divided by another.
How to cite
Jag DeSaint, "The dollar index gained 7.6 points in one year and 2.0 in the three that followed," The Cefa Brief, Applied America, 4 de dezembro de 2025, https://applied.thecefa.org/cefa-brief/a-strong-dollar-is-a-level-not-a-move.
About the author

Each author told us that for this piece they hold no interest a reader would think relevant.
This Insights piece carries its author's name because the view in it is the author's own. An editor reviewed it before publication, which is not the same as agreeing with it. It is not a position of the Center for Economics & Foreign Affairs or of Applied America.
© 2025. The author or authors hold the copyright in this Insights piece; CEFA publishes it with their permission. This edition, its editing and its presentation are © 2025 Center for Economics & Foreign Affairs. To republish it, see our republication terms. Republishing
Share
The Cefa Brief · applied.thecefa.org/cefa-brief/a-strong-dollar-is-a-level-not-a-move · Printed from the web edition