
ConstataçãoInternational Partners
Goods exports to mainland China are lower in 2025 than in 2020
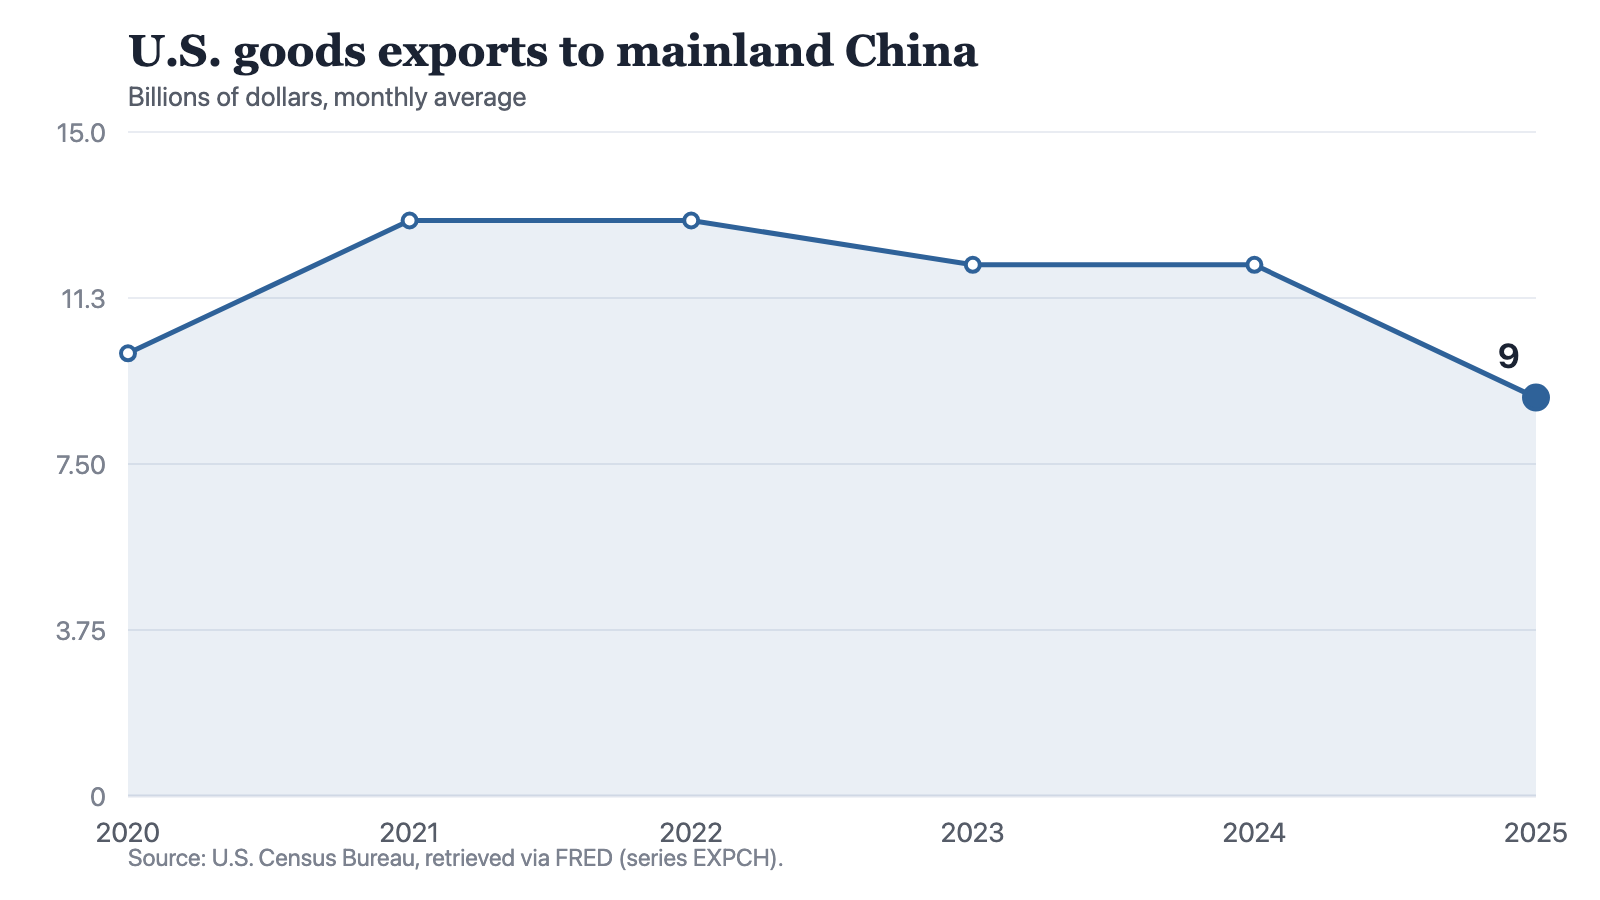
The monthly average rose to 13 billion dollars in 2021, stayed between 12 and 13 for four years, then fell to 9 in 2025, the lowest of the six readings. Imports from China fell further in the same year, so the gap between the two series is at its narrowest while exports are at their weakest.
by
Published 2 minute read

Ilustração: The Cefa Brief
U.S. goods exports to mainland China are lower at the end of the available window than at the start. The monthly average was 10 billion dollars in 2020 and 9 billion in 2025, one billion less. The 2025 reading is the lowest of the six. Each point is a monthly average, not a year's exports.
The six readings are 10 billion dollars in 2020, 13 in 2021, 13 in 2022, 12 in 2023, 12 in 2024 and 9 in 2025.
Year on year the series added 3 billion, then held level, then gave back 1 billion, then held level again, then fell 3 billion. The whole shape is one rise at the front, four years between 12 and 13, and one fall at the end. That last fall is a quarter of the 2024 reading and takes the series 4 billion below its high of 13.
Notes: Annual observations. Each point is the average of the periods within the year, not the year’s total.
Source: The Cefa Brief
Chart description
A line chart of U.S. goods exports to mainland China, as a monthly average in billions of dollars: 10 billion in 2020, 13 in 2021, 13 in 2022, 12 in 2023, 12 in 2024 and 9 in 2025. The line rises once at the start, runs almost level for four years, then falls at the end to the lowest point on the chart.
A line chart of U.S. goods exports to mainland China, as a monthly average in billions of dollars: 10 billion in 2020, 13 in 2021, 13 in 2022, 12 in 2023, 12 in 2024 and 9 in 2025. The line rises once at the start, runs almost level for four years, then falls at the end to the lowest point on the chart.
The gap narrowed on both sides
Goods imports from China run 36 billion dollars in 2020, 42 in 2021, 45 in 2022, 36 in 2023, 37 in 2024 and 26 in 2025, on the same monthly-average basis. Subtracting exports from imports gives a gap of 26, 29, 32, 24, 25 and 17 billion. The narrowest gap in the window is the last one.
It narrowed because imports fell by 11 billion while exports fell by 3, so the gap closed by 8. Nothing in either series shows exports recovering. A reader who tracks only the bilateral balance would record an improvement in the year that the export series reached its lowest reading.
What the readings cannot settle
One limit sits on these readings. The points are stored as whole billions, which is coarse enough that the flat stretch between the two readings of 12 may not be flat in the underlying data, and coarse enough that the year-to-year steps and the import gaps carry the same rounding. What that coarseness does not touch is the size of the last move: a fall from 12 to 9 is far too large to be an artefact of rounding. Every year in the window closed before the figures were retrieved, so the 2025 reading is a full twelve-month average and not a part-year one.
The series also says nothing about why it moved. It counts goods leaving for mainland China in dollars. It does not separate a fall in volumes from a fall in prices, it does not cover services, and it does not follow goods that reach China through somewhere else. Tariffs, export controls, Chinese demand and rerouting all produce the same mark on this line, which is why the line cannot be used to choose between them.
Two things would sharpen the answer. Values carried below whole billions would show whether the middle of the window is as flat as it looks here. Monthly rather than annual observations would show when in the window the fall began, which is the difference between a policy response and a longer retreat. Until then the defensible sentence is the narrow one: exports to mainland China, measured in dollars, are at their lowest reading of the six, and the gap between the two series is at its narrowest because both sides of it fell.
Method and data
The figures are annual observations of U.S. goods exports to mainland China, series EXPCH, published by the U.S. Census Bureau, redistributed by FRED and retrieved for this site on 19 September 2026. The unit is billions of dollars as a monthly average, so each year's point is the average of that year's months and not the year's total; reading 9 billion dollars as a year of exports would be wrong by roughly a factor of twelve. Every year in the window, 2025 included, closed before the retrieval date, so each point is a full twelve-month average rather than a part-year one. The points are stored here as whole billions, so two readings both shown as 12 need not be equal in the underlying series, and the year-to-year steps and the import gaps quoted in the text inherit that rounding. Those gaps are arithmetic performed here by subtracting one stored series from the other; the two series are compiled separately and on their own bases, and the result is not the published bilateral goods balance. The series counts goods and not services, investment income or anything else in the relationship; its title names mainland China, and the record here does not state how goods reaching China through third places are treated. It is stated in dollars without adjustment for prices, and it gives no reason for any movement in it. The import series quoted in the text is a separate series from the same agency, named for contrast.
How to cite
Jag DeSaint, "Goods exports to mainland China are lower in 2025 than in 2020," The Cefa Brief, Applied America, 24 de agosto de 2026, https://applied.thecefa.org/cefa-brief/a-narrower-gap-is-not-a-better-one.
About the author

Each author told us that for this piece they hold no interest a reader would think relevant.
This Insights piece carries its author's name because the view in it is the author's own. An editor reviewed it before publication, which is not the same as agreeing with it. It is not a position of the Center for Economics & Foreign Affairs or of Applied America.
© 2026. The author or authors hold the copyright in this Insights piece; CEFA publishes it with their permission. This edition, its editing and its presentation are © 2026 Center for Economics & Foreign Affairs. To republish it, see our republication terms. Republishing
Share
The Cefa Brief · applied.thecefa.org/cefa-brief/a-narrower-gap-is-not-a-better-one · Printed from the web edition