
Two years of decline have taken the mortgage rate 0.21 points off its peak
The thirty-year fixed rate peaked at 6.81 per cent in 2023, and the two annual readings since are 6.72 and 6.6. The federal funds rate ended those same two years 0.81 points lower, nearly four times as far, though it rose before it fell.
by
Published 2 minute read

插图:The Cefa Brief
The thirty-year fixed mortgage rate peaked at 6.81 per cent in 2023. The two annual readings since are 6.72 and 6.6. Together they take 0.21 percentage points off the peak, and that is the whole of the decline so far.
The six readings are 3.11 per cent in 2020, 2.96 in 2021, 5.34 in 2022, 6.81 in 2023, 6.72 in 2024 and 6.6 in 2025. The 2021 reading is the lowest of the six and the only one below 3 per cent. The last three readings are all 6.6 or higher.
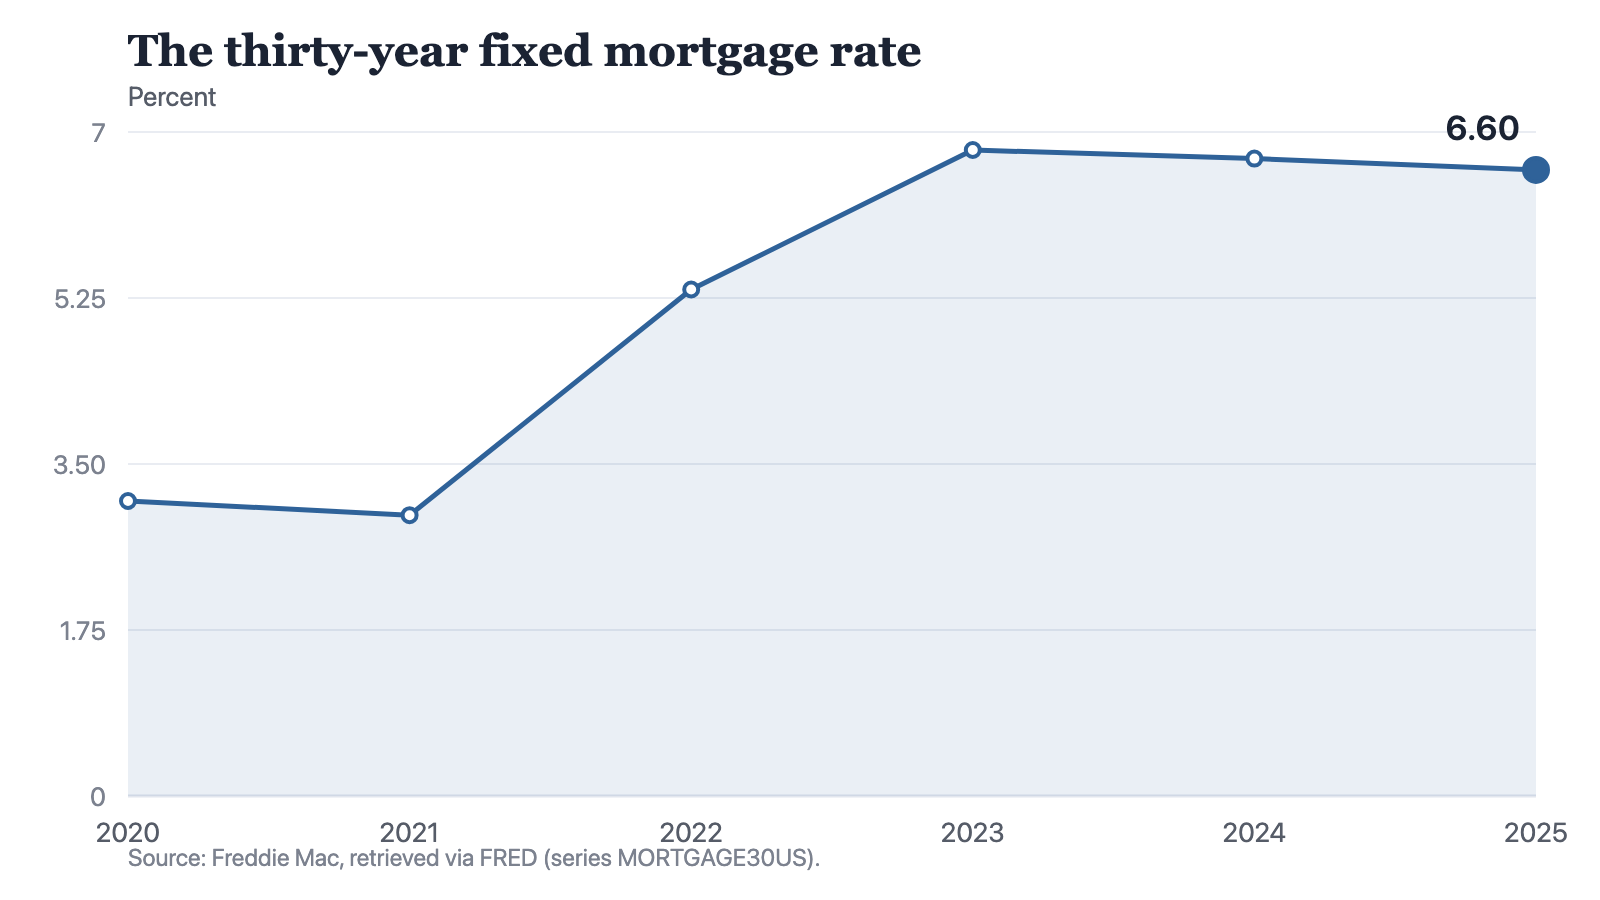
Notes: Annual observations. Each point is the annual observation as the source publishes it.
Source: The Cefa Brief
Chart description
A line chart of the thirty-year fixed mortgage rate: 3.11 per cent in 2020, 2.96 in 2021, 5.34 in 2022, 6.81 in 2023, 6.72 in 2024 and 6.6 in 2025. The line dips slightly to its lowest point in 2021, climbs steeply for two years to its highest point in 2023, then edges down a little in each of the last two years.
A line chart of the thirty-year fixed mortgage rate: 3.11 per cent in 2020, 2.96 in 2021, 5.34 in 2022, 6.81 in 2023, 6.72 in 2024 and 6.6 in 2025. The line dips slightly to its lowest point in 2021, climbs steeply for two years to its highest point in 2023, then edges down a little in each of the last two years.
Two large steps up, two small ones down
The series fell 0.15 points into 2021, rose 2.38 into 2022 and 1.47 into 2023, then fell 0.09 into 2024 and 0.12 into 2025. The climb from the 2021 low to the 2023 peak is 3.85 points, larger than the 2021 rate itself, and the 2023 reading is 2.3 times the 2021 reading. The two declines that followed come to 0.21 points, 5.5 per cent of that climb.
The policy rate went further
The federal funds effective rate averaged 5.02 per cent in 2023, 5.14 in 2024 and 4.21 in 2025. Between the 2023 and the 2025 averages it fell 0.81 points against the mortgage rate's 0.21, nearly four times as far. Between the 2024 and the 2025 averages the difference is wider still, 0.93 points against 0.12, almost eight times as far. The two series do not even peak in the same year: the mortgage rate in 2023, the policy rate in 2024.
The policy rate is not the rate a thirty-year mortgage is priced from, and nothing in these two series establishes what is. Six annual points each cannot separate a lag from a break, or either from a coincidence. The comparison shows something narrower and firmer than a mechanism. Over the same two years, one rate came down 0.81 points and the other came down 0.21.
What an annual average hides
Each point here is the average of a year's readings, not the rate on any date. A rate that fell through one half of a year and rose through the other lands on an average that resembles neither half. Three consecutive readings of 6.81, 6.72 and 6.6 describe a plateau at the annual scale. They describe nothing at all about the path within any of those three years.
The window ends in 2025, so no figure here says where the rate stands now. Two things would change the answer. A 2026 reading well below 6.6 would turn two small declines into a trend, while another reading near 6.6 would make the plateau four years long. Either way the series records one rate on one product. It is not a record of what any borrower paid, and not evidence that a single loan was written.
Method and data
The figures are annual observations of the thirty-year fixed mortgage rate, series MORTGAGE30US, published by Freddie Mac, redistributed by FRED and retrieved for this site on 19 September 2026. They are stated in per cent, and each annual point is the average of that year's published readings rather than a rate on any single date, so a turn inside a year does not appear in the line. The series is a single rate on a single product: it does not cover adjustable-rate loans or any other term, it is not a record of what any borrower paid, and it says nothing about how many loans were written or how many houses were bought. The federal funds effective rate quoted in the text is a separate series from a separate agency, named for contrast only; nothing here tests a relationship between the two. The window ends at 2025, so no figure in this piece describes where the rate stood on the retrieval date.
How to cite
Jag DeSaint, "Two years of decline have taken the mortgage rate 0.21 points off its peak," The Cefa Brief, Applied America, 2026年2月23日, https://applied.thecefa.org/cefa-brief/the-mortgage-rate-did-not-follow.
About the author

Each author told us that for this piece they hold no interest a reader would think relevant.
This Insights piece carries its author's name because the view in it is the author's own. An editor reviewed it before publication, which is not the same as agreeing with it. It is not a position of the Center for Economics & Foreign Affairs or of Applied America.
© 2026. The author or authors hold the copyright in this Insights piece; CEFA publishes it with their permission. This edition, its editing and its presentation are © 2026 Center for Economics & Foreign Affairs. To republish it, see our republication terms. Republishing
Share
The Cefa Brief · applied.thecefa.org/cefa-brief/the-mortgage-rate-did-not-follow · Printed from the web edition