
Since 2022 the home-price index has risen 10.1 per cent while the median new house has sold for less each year
The index stands at 328.5 for 2025 against 298.3 for 2022, and the median price of a new house sold runs 433, 427, 419 and 415 thousand dollars over the same four readings. The two series cover different housing and report different statistics, so neither one corrects the other.
by
Published 3 minute read

插图:The Cefa Brief
The national home-price index has risen in every year of the window. It reads 328.5 for 2025 against 222.1 for 2020, on a base of 100 in January 2000. Across those five steps it added 106.4 index points, a rise of 47.9 per cent, and there is no down year in the series.
Year on year the index added 37.9 points, then 38.3, then 7.4, then 15.7, then 7.1. Two large steps come first and three small ones follow. The largest step, 38.3 points into 2022, is 5.4 times the smallest, 7.1 points into 2025.
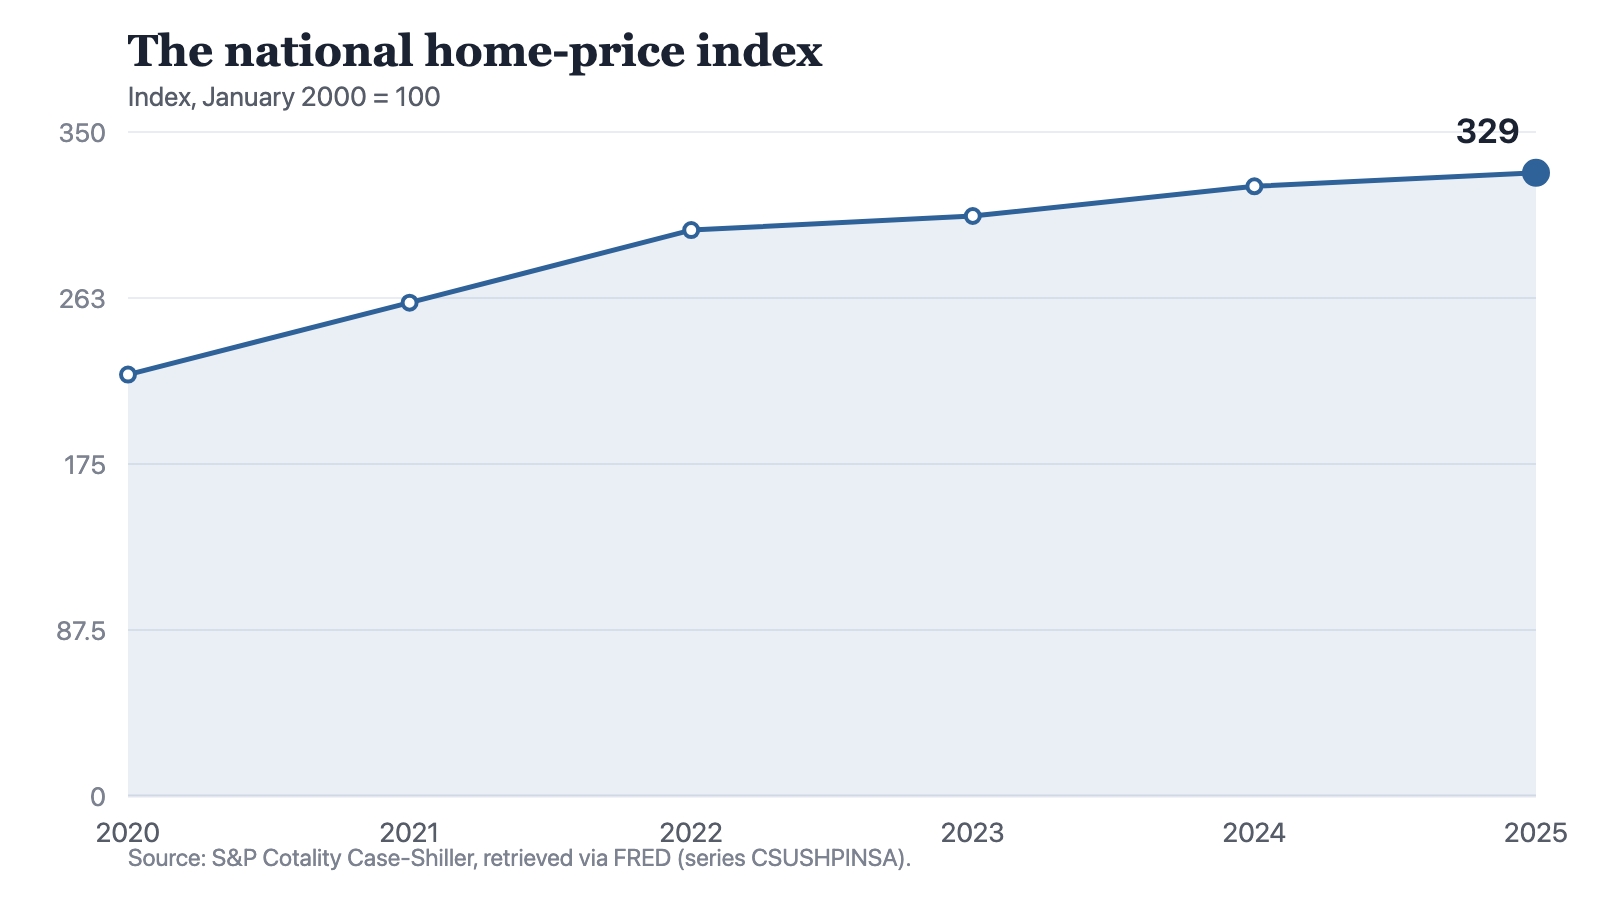
Notes: Annual observations. Each point is the average of that year's published readings, and every value is an index level against the January 2000 base rather than a price.
Source: The Cefa Brief
Chart description
A line chart of the national home-price index: 222.1 in 2020, 260 in 2021, 298.3 in 2022, 305.7 in 2023, 321.4 in 2024 and 328.5 in 2025. The line rises at every step. The two steps to 2022 are much the steepest, the step to 2023 is shallow, the line picks up somewhat into 2024, and the step to 2025, of 7.1 points, is the shallowest in the series.
A line chart of the national home-price index: 222.1 in 2020, 260 in 2021, 298.3 in 2022, 305.7 in 2023, 321.4 in 2024 and 328.5 in 2025. The line rises at every step. The two steps to 2022 are much the steepest, the step to 2023 is shallow, the line picks up somewhat into 2024, and the step to 2025, of 7.1 points, is the shallowest in the series.
Where the rise happened
Of the 106.4 points added between 2020 and 2025, 76.2 arrived in the first two steps and 30.2 in the last three. That is 71.6 per cent of the whole rise complete by the 2022 reading. A line that only goes up reads as a market rising throughout. The increments say the rise was front-loaded, and that what has come since 2022 has come slowly.
A second national number, moving the other way
The median price of a new house sold runs 328, 383, 433, 427, 419 and 415 thousand dollars across the same six years. It peaked at 433 in 2022 and has fallen in each of the three years since, by 6 thousand dollars, then 8, then 4. The 2025 reading is 18 thousand below the peak, a fall of 4.2 per cent, and 87 thousand above where the series began in 2020.
Measured from 2022, the two series point in opposite directions. The index has added 30.2 points, a rise of 10.1 per cent. The median new house has sold for 18 thousand dollars less, a fall of 4.2 per cent. Both statements cover the same three years, and both are correct.
An index measures change. A median reports the middle of what sold. Those are different questions, and since 2022 they have returned different answers.
What each measure answers
The difference is in coverage and in the statistic. One series is a national home-price index, carried on a January 2000 base of 100, and it records the level of home prices against that base. The other is a median, the middle price among the new houses that sold, and it covers new houses only. A median moves when prices move and it moves when the mix of what sold moves. An index on a fixed base does not answer the second of those at all.
That is enough to produce the divergence without either number being wrong. Builders selling smaller or cheaper houses would pull the median down whether or not any house had become cheaper. Housing generally changing hands at higher prices would push the index up whether or not a single new house was built. Which of those is happening cannot be settled here, because this brief holds no series on the size or the mix of the houses that sold, and dividing one of these series by the other would produce nothing worth reading.
Two limits on the index
The index is a national composite. It contains no state, metro or city detail, and no reading in it describes any particular housing market. It is also an index and not a price: 328.5 is a level against a base of 100 in January 2000, and there is no arithmetic in this brief that turns it into a dollar figure.
Both series end at 2025, so nothing here describes where either of them stood on 19 September 2026. What the six readings support is narrow and worth stating plainly. The national home-price index has not fallen in any year since 2020, 71.6 per cent of its rise was complete by 2022, and a second national measure of house prices has moved down in each year since. Anyone who wants one answer to what has happened to house prices has to say first which of those two questions is being asked.
Method and data
The figures are annual observations of the national home-price index, series CSUSHPINSA, published by S&P Cotality Case-Shiller, redistributed by FRED and retrieved for this site on 19 September 2026. The unit is an index on a base of 100 in January 2000, so every value is a level against that base and not a price. No figure taken from this series is a dollar amount, and the index cannot be turned into one. Each annual point is the average of that year's published readings, so a peak or trough inside a year does not appear in the line. The series is a single national composite: it carries no state, metro or city detail, it says nothing about how many houses changed hands or what any buyer paid, and it is not adjusted for the general price level.
The median price of a new house sold is a separate series, MSPUS, published by the U.S. Census Bureau and HUD, redistributed by FRED and retrieved on the same date. It is stated in thousands of dollars, and each annual point is the average of that year's published readings. It is a median, which is to say the middle price among the new houses that sold, so it moves with the prices of houses and it moves with the mix of houses sold. It covers new houses only. It is named here for contrast. Nothing in this piece divides one series by the other, and no figure here is a ratio of the two.
The window runs from 2020 to 2025 for both series and holds no reading for 2026, so no figure in this piece describes where either series stood on the retrieval date.
How to cite
Jag DeSaint, "Since 2022 the home-price index has risen 10.1 per cent while the median new house has sold for less each year," The Cefa Brief, Applied America, 2026年10月12日, https://applied.thecefa.org/cefa-brief/most-of-the-rise-was-over-by-2022.
About the author

Each author told us that for this piece they hold no interest a reader would think relevant.
This Insights piece carries its author's name because the view in it is the author's own. An editor reviewed it before publication, which is not the same as agreeing with it. It is not a position of the Center for Economics & Foreign Affairs or of Applied America.
© 2026. The author or authors hold the copyright in this Insights piece; CEFA publishes it with their permission. This edition, its editing and its presentation are © 2026 Center for Economics & Foreign Affairs. To republish it, see our republication terms. Republishing
Share
The Cefa Brief · applied.thecefa.org/cefa-brief/most-of-the-rise-was-over-by-2022 · Printed from the web edition