
The labour force fell in 39 of 51 jurisdictions in a single month
Between June and July 2026 the civilian labour force fell in 39 states and the District of Columbia's column, and rose in twelve. The movements are tiny, they point the same way, and the file that records them cannot tell you whether that means anything.
by
Vantage point
I write from the editor's desk of this brief, where the argument about whether to print a one-month change at all was settled by printing it with its limits attached.
Published 7 minute read

插图:The Cefa Brief
In June 2026 the civilian labour force in Michigan was 4,906,650 people. In July it was 4,877,860. Twenty-eight thousand seven hundred and ninety people left the count in one month, which is a little over half of one percent of it. The same month, California's count fell by 70,227 - the largest absolute fall of the 51 jurisdictions - and Kentucky's rose by 6,183.
Add up the direction of travel and the pattern is one-sided. Thirty-nine of the 51 jurisdictions recorded a smaller civilian labour force in July than in June. Twelve recorded a larger one. None was unchanged. Every jurisdiction in the country moved, and most of them moved down, in the same month. That is the kind of sentence a brief can sell, and it is three quarters of the way to a headline about a shrinking American workforce. I want to spend this piece explaining why I will not write that headline, what the number can carry, and what I think it is genuinely for.
Two observations are not a trend
This dataset holds two points per state: an observation dated 1 July 2026 and a prior observation dated 1 June 2026. That is the whole history. There is no May, no third point, nothing to establish whether the June figure was itself high or low. A change between two observations is a difference. A trend needs a third point to say which way the difference is bending, and there isn't one.
The consequence is strict. I can tell a reader that Michigan's count fell by 28,790 people between those two dates. I cannot tell them that Michigan's labour force is shrinking, because shrinking is a claim about a sequence and I have a pair. The distinction sounds pedantic until you notice how much published commentary about state economies consists of exactly this substitution, made silently, in the space between a table and its headline.
There is a second limit stacked on the first. The file records no revision history. Agencies revise state labour force estimates as better information arrives, and a figure that has already been revised looks identical here to one that has not. So the pair I am working from is a pair of provisional numbers, and the difference between them is the difference between two estimates as they stood when this dataset was built.
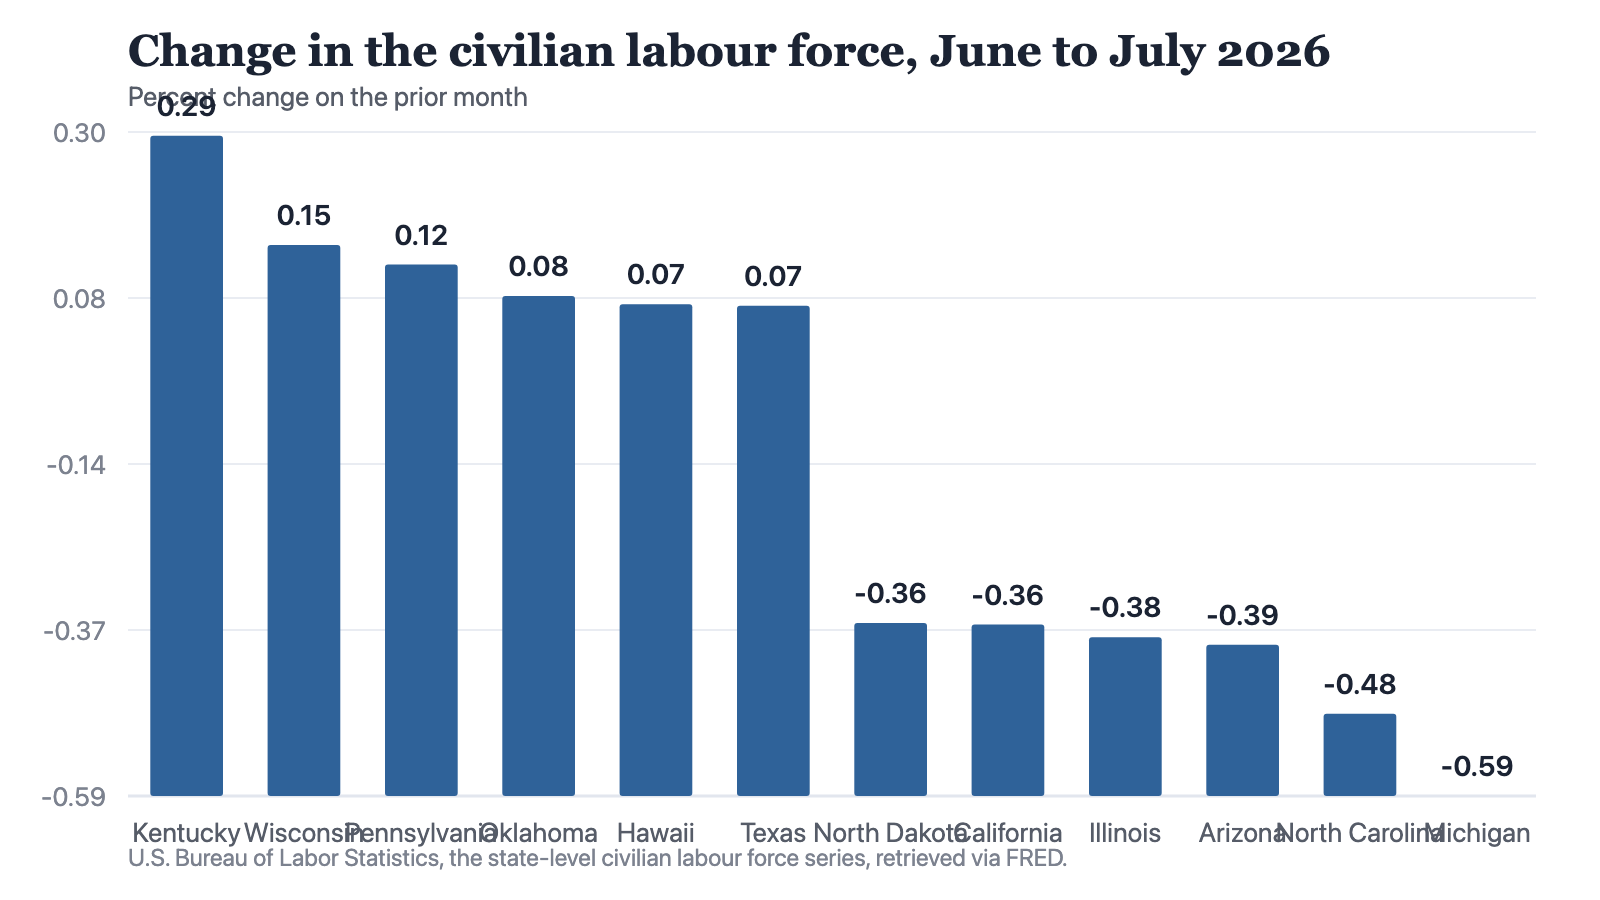
Notes: U.S. Bureau of Labor Statistics, state-level civilian labour force series, retrieved via FRED. Observations dated 2026-07-01 and 2026-06-01. Percentage change computed from the two published counts.
Source: The Cefa Brief
Chart description
Twelve bars ordered from largest rise to largest fall. Kentucky plus 0.295 percent, Wisconsin plus 0.149, Pennsylvania plus 0.123, Oklahoma plus 0.081, Hawaii plus 0.070, Texas plus 0.068; then North Dakota minus 0.356, California minus 0.358, Illinois minus 0.375, Arizona minus 0.385, North Carolina minus 0.477, Michigan minus 0.587. The 39 jurisdictions between the two groups are omitted from the chart but not from the count of directions. The entire spread from the largest rise to the largest fall is 0.882 of a percentage point.
Twelve bars ordered from largest rise to largest fall. Kentucky plus 0.295 percent, Wisconsin plus 0.149, Pennsylvania plus 0.123, Oklahoma plus 0.081, Hawaii plus 0.070, Texas plus 0.068; then North Dakota minus 0.356, California minus 0.358, Illinois minus 0.375, Arizona minus 0.385, North Carolina minus 0.477, Michigan minus 0.587. The 39 jurisdictions between the two groups are omitted from the chart but not from the count of directions. The entire spread from the largest rise to the largest fall is 0.882 of a percentage point.
Look at the vertical scale before anything else. The largest rise in the country is under three tenths of one percent. The largest fall is under six tenths. Every one of the 51 jurisdictions sits inside a band less than nine tenths of a percentage point wide. On any chart drawn to a sensible axis these are not twelve different outcomes. They are one outcome with rounding.
That is worth stating because the presentation of state data almost always inverts it. Rank 51 jurisdictions on anything and the ranking will look meaningful, because a list has a top and a bottom whatever the spread between them. Kentucky is first and Michigan is last on this measure, and a reader shown that ordering without the axis would reasonably assume the two states had experienced different months. They did not. They experienced the same month, and the measuring instrument reported a difference of less than one percentage point between the most and least extreme cases in the country.
Why the agreement is the interesting part
The one genuinely notable feature is not the size of any movement but the agreement in direction. Thirty-nine of 51 is not what independent state labour markets would produce. If each state were moving on its own local conditions - a plant closing here, a season opening there - the split would be closer to even, and the outliers would be the states with an identifiable local event. Instead the outliers are unremarkable and the middle is uniform. A split that lopsided means something common is acting on all of them at once, and the common factor is the thing worth naming.
There are two families of explanation, and this file cannot separate them. The first is that something national happened between June and July 2026 that took people out of the labour force everywhere at once. The second is that what I am looking at is a feature of the measurement - a seasonal pattern that recurs every June to July, or a common methodological artefact, or both.
The file records no seasonal adjustment flag for this series. It gives me a label, an agency, a unit of persons, and two dated integers per state. So I cannot tell a reader which family the answer belongs to, and I decline to guess, because the guess would be doing all the work while the data took the credit.
Thirty-nine of 51 moving the same way is not what independent state labour markets produce. It is either one national event or one measurement artefact, and this file cannot tell me which.
I will say what would settle it. A run of the same June-to-July comparison over several years would show immediately whether a July fall is what this series does every year. That history exists at the agency that publishes the series. It is not in this dataset, and a reader is better served by being told where to go than by being handed a confident paragraph assembled from two numbers.
What the number is actually for
None of this makes the series useless. It makes the delta the wrong thing to look at and the level the right one.
If the question is whether a state can staff a facility, the relevant figure is that Michigan has 4,877,860 people in its civilian labour force and North Dakota has 431,386. That ratio is eleven to one and it does not move perceptibly in a month, a quarter, or plausibly a year. Every decision that actually turns on labour supply - where to site a plant, whether a second shift is realistic, how deep the local pool is for a given trade - turns on the level and on its composition, not on the last month's difference.
The delta has one honest use: as a prompt. A jurisdiction whose count moved hard relative to its own size is worth a closer look in better data. Michigan at minus 0.587 percent is a reason to open the agency's own series for Michigan, with its full history and its revisions attached. It is not, by itself, a finding about Michigan, and treating a prompt as a finding is the most common way a good dataset produces a bad decision.
Added together, the 51 counts in this file fall by 276,744 people between the two dates, from 170,168,849 to 169,892,105. I give that figure with a warning: it is a sum of this file's state estimates and not the national civilian labour force, which is produced by a different survey and is not held here. Its only use is scale. A quarter of a million people is a sixth of one percent of the total, and a sixth of one percent is not a national event until something else says it is.
The objection, and where it lands
The serious objection to everything above is that an analyst who refuses to interpret data has not been careful, only unhelpful. Decisions get made monthly. Someone has to read the monthly number. A brief that responds to every movement by listing what cannot be concluded from it has outsourced its job to the reader while keeping the byline.
I think that objection lands about half way. It is right that refusal is not analysis, and it is right that a reader who wanted only caveats could generate them without us. Where it fails is in assuming the alternative on offer is a better reading rather than a more confident one. The choice here is not between interpreting and refusing. It is between saying that 39 of 51 moved down in one month and cannot yet be explained, or saying that the American labour force is contracting - which is the sentence this data will be used to support, and which it does not support. The second is more useful to a reader in every way except the one that matters, which is whether it is true, and the cost of getting it wrong is not symmetric. A reader who acts on a seasonal pattern mistaken for a contraction has made a real decision on an artefact. A reader told to wait for a third observation has lost a month.
So: the labour force fell in 39 of 51 jurisdictions between June and July 2026. The falls are small, the range across the whole country is less than nine tenths of a percentage point, and the agreement in direction is the only feature that is hard to explain by chance. I do not know what caused it. The file does not know either, and the difference between a brief and a feed is that one of them says so.
How to cite
Jag DeSaint, "The labour force fell in 39 of 51 jurisdictions in a single month," The Cefa Brief, Applied America, 2026年7月27日, https://applied.thecefa.org/cefa-brief/one-month-of-labour-force.
About the author

Each author told us that for this piece they hold no interest a reader would think relevant.
This Perspectives piece carries its author's name because the view in it is the author's own. An editor reviewed it before publication, which is not the same as agreeing with it. It is not a position of the Center for Economics & Foreign Affairs or of Applied America.
© 2026. The author or authors hold the copyright in this Perspectives piece; CEFA publishes it with their permission. This edition, its editing and its presentation are © 2026 Center for Economics & Foreign Affairs. To republish it, see our republication terms. Republishing
Share
The Cefa Brief · applied.thecefa.org/cefa-brief/one-month-of-labour-force · Printed from the web edition