
Jobs are counted where they are done, not where workers live
In July 2026 the District of Columbia held 179.7 jobs for every 100 people in its own labour force, and Maryland held 87.9. The two numbers are measuring different things, and state rankings that put them side by side quietly mislead.
by
Published 4 minute read

插图:The Cefa Brief
Two numbers appear in the same row of almost every state economic table. One is total nonfarm employment, the count of jobs. The other is the civilian labour force, the count of people. They are collected by the same agency and they are not the same kind of thing, and the moment you divide one by the other the difference stops being a footnote.
For July 2026 the District of Columbia carried 722.4 thousand payroll jobs against a labour force of 401,923 people. That is 179.7 jobs for every 100 people in the District's own labour force. Maryland, next door, carried 2,815.9 thousand jobs against a labour force of 3,202,897, which is 87.9 per 100 and the lowest ratio of the 51 jurisdictions in the file. Virginia sits between them at 94.6. Nobody should conclude that Washington is roughly twice as industrious as Maryland. The three numbers are describing one labour market that happens to be cut by two state lines.
The claim
My position is that a state job count does not belong to that state's residents, and that any regional argument built on the count alone is unfinished. The payroll series answers a question about establishments: how many jobs sit inside this boundary. The labour force series answers a question about households: how many of the people who sleep here are working or looking. For a county with a commuter belt, for a capital city, for an oil basin with a rotating workforce, those are not close to the same question.
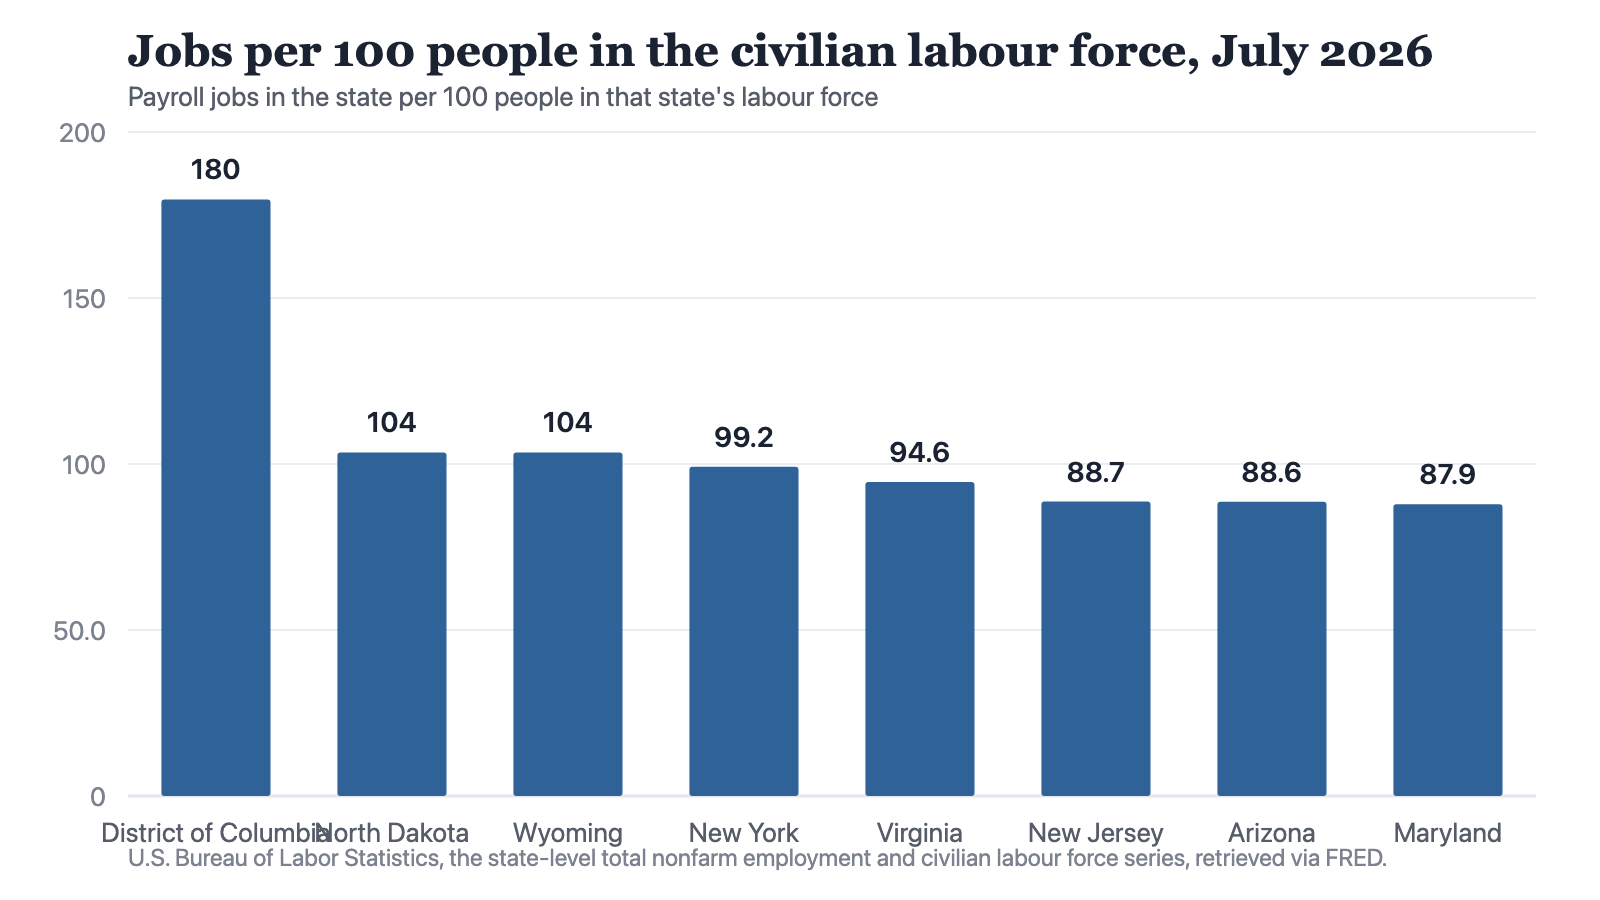
Notes: Computed from two Bureau of Labor Statistics series for the same month. Above 100 means more payroll jobs located in the state than people in its labour force; below 100 is the ordinary case, and the 51-jurisdiction figure is 93.5.
Source: The Cefa Brief
Chart description
Eight bars, descending. The District of Columbia at 179.7 is an outlier by a wide margin, roughly three-quarters again as many jobs as workers. North Dakota and Wyoming tie at 103.5, the only other jurisdictions above 100. New York at 99.2, Virginia at 94.6 and then a cluster of net exporters of labour: New Jersey 88.7, Arizona 88.6 and Maryland 87.9, the lowest in the file. The visual gap between the District of Columbia and everything else is the point of the chart, not an error in it.
Eight bars, descending. The District of Columbia at 179.7 is an outlier by a wide margin, roughly three-quarters again as many jobs as workers. North Dakota and Wyoming tie at 103.5, the only other jurisdictions above 100. New York at 99.2, Virginia at 94.6 and then a cluster of net exporters of labour: New Jersey 88.7, Arizona 88.6 and Maryland 87.9, the lowest in the file. The visual gap between the District of Columbia and everything else is the point of the chart, not an error in it.
Only three of the 51 jurisdictions hold more payroll jobs than they hold labour force. The District of Columbia is the obvious one. North Dakota and Wyoming, both at 103.5, are the less obvious ones, and they are worth a moment. These are small-population states with extraction and construction bases, and the same reading would follow from workers arriving across a state line, from workers on rotation, or from residents holding a second payroll job. The ratio cannot tell you which, and I will not pretend that it can.
The objection
The fair objection is that everyone in the field already knows this. Payroll data is establishment-based, household data is residence-based, the distinction is in the first page of every methodology note, and nothing is gained by restating it. If the reader is a labour economist, that objection holds completely.
Most readers of a state comparison are not labour economists. They are people deciding where to site a facility, where to put a training programme, or how to argue for a road. And the practical failure is not that they confuse the two definitions; it is that they use the job count as though it measured the resident population's access to work. Strip out the District of Columbia and the remaining 50 states still run from 87.9 to 103.5, a spread of roughly 16 points. That is wider than most of the differences these comparisons are built to adjudicate.
The Washington triangle is the loudest case but not the only one. New York holds 9,960.7 thousand payroll jobs against a labour force of 10,039,429, a ratio of 99.2, while New Jersey holds 4,357.6 thousand jobs against 4,910,656 people, a ratio of 88.7. Two adjoining states, ten and a half points apart on a ratio that has nothing to do with how hard anyone works. I cannot prove from these two series which residents cross which line, and I am not going to try. What I can say is that a comparison treating the job column as a report card on the state is scoring a number that the state boundary did not earn on its own.
There is a second objection, and it is the stronger one: the ratio is overdetermined. A state can sit below 100 because its residents commute out, because it has unemployed residents who count in the labour force and hold no job, or because a large share of its working residents are self-employed or farm workers and therefore outside nonfarm payrolls entirely. All three push in the same direction and this arithmetic cannot separate them. That is true, and it is why the ratio is a diagnostic rather than a finding. It tells you the two series have diverged in this place and that you now need a different instrument. It does not tell you why.
What it changes in practice
Three things follow for anyone using state labour data to make a decision that lasts longer than a news cycle.
- Do not divide a state's jobs by its population or its labour force and call the result an employment rate. It is a location ratio, and in the District of Columbia it would produce a number above 100 that means nothing about employment.
- When a state's ratio sits far from the 93.5 that the 51 jurisdictions produce together, treat the state boundary as the wrong unit for the question and look for the labour market that actually exists.
- When comparing two states' job growth, confirm that the workforce serving those jobs lives in the state you are crediting. In the Washington, Maryland and Virginia triangle it demonstrably does not.
None of this requires better data. The two series are published monthly, they are free, and they are already sitting next to each other in the table. What it requires is the discipline to notice that a column of jobs and a column of people are not two views of one quantity, and that the ratio between them is a fact about geography rather than a fact about effort. The District of Columbia's 179.7 is not an achievement. It is a map.
About the author

Each author told us that for this piece they hold no interest a reader would think relevant.
This commentary carries its author's name because the view in it is the author's own. An editor reviewed it before publication, which is not the same as agreeing with it. It is not a position of the Center for Economics & Foreign Affairs or of Applied America.
© 2026. The author or authors hold the copyright in this commentary; CEFA publishes it with their permission. This edition, its editing and its presentation are © 2026 Center for Economics & Foreign Affairs. To republish it, see our republication terms. Republishing
Share
The Cefa Brief · applied.thecefa.org/cefa-brief/jobs-are-counted-where-they-are-done · Printed from the web edition