
Local infrastructure is limited by the people who can run a project, not by the price of money
The ten-year Treasury rose from 0.89 percent in 2020 to 4.29 in 2025 and nonresidential construction spending rose alongside it, from 856 billion dollars a year to 1,309. What complicates the argument is that the only capacity measure held here counts business and financial operations workers across every industry, not the staff of any city hall.
by
Published 4 minute read

插图:The Cefa Brief
My position is that the binding constraint on local infrastructure delivery is administrative capacity, not access to finance. That is a claim about which of the two, if it were relieved tomorrow, would produce more finished projects. The evidence held on this site supports it, and I will say where it stops supporting it.
Begin with the finance claim, because it is the one that can be tested against a price. If the cost of long money were binding, the years in which money became dearest ought to be the years in which least was built.
The price of money rose and the building did not stop
The ten-year Treasury constant maturity rate runs 0.89 percent in 2020, 1.45 in 2021, 2.95 in 2022, 3.96 in 2023, 4.21 in 2024 and 4.29 in 2025, a rise of 3.40 points across the window. Nonresidential construction spending, stated at a seasonally adjusted annual rate, runs 856 billion dollars in 2020, 845 in 2021, 968 in 2022, 1,193 in 2023, 1,295 in 2024 and 1,309 in 2025. The second series ends 453 billion dollars a year above where it began.
Set the two sets of steps beside each other. The yield added 0.56 points, then 1.50, then 1.01, then 0.25, then 0.08. Spending moved by minus 11 billion dollars a year, then 123, then 225, then 102, then 14. The two years in which the yield rose most, 2022 and 2023, are the two years in which spending rose most. The single year spending fell is 2021, when the yield stood at 1.45 percent, the second-lowest reading of the six.
One observation looks, at first, like a point for the other side. Spending added 14 billion dollars a year in 2025, the smallest rise in the series. It arrived in the year the yield moved least, by 0.08 points, and in the year the yield sat highest, at 4.29 percent. The change in the price of credit had almost stopped. The level had not come down. A rise of 0.08 points cannot account for a slowdown in building. A rate held at 4.29 percent might, and that is the one reading in these two series that leaves the finance claim standing.
The ten-year is one number for the whole country. Delivery is not one number for the whole country. A constraint that is identical everywhere cannot explain a difference between places.
What a bench looks like when you count it
Dispersion is why I put the constraint on the other side of the question. The Bureau of Labor Statistics publishes, for each of 51 jurisdictions, employment in the major occupational group Business and Financial Operations Occupations, code 13-0000. These are the accountants, budget analysts, purchasing agents, compliance officers and project management specialists that a capital programme runs on. Adding the 51 state estimates gives 10,537,210 such workers against 155,495,750 jobs in total, or 67.765 per thousand. The addition is mine and the estimates are the file's, and a sum of independently produced state figures is not an official national total.
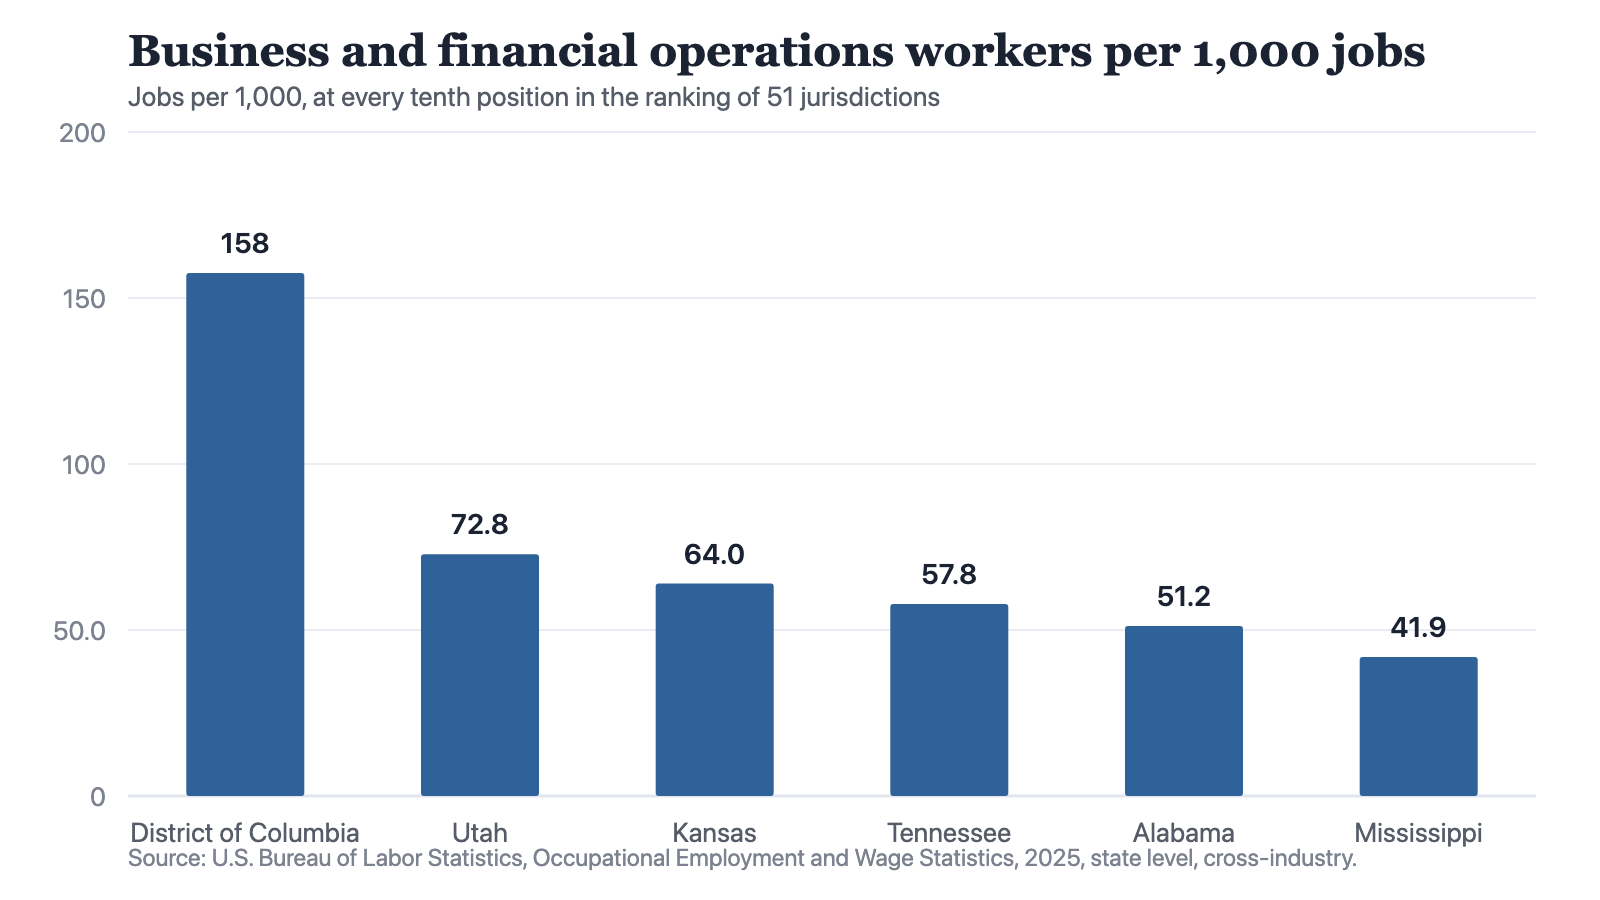
Notes: Bureau of Labor Statistics Occupational Employment and Wage Statistics, 2025, state level, cross-industry. Jobs-per-thousand values are the file's own field. The rate across all 51 jurisdictions combined is 67.765 per thousand.
Source: The Cefa Brief
Chart description
A bar chart of business and financial operations workers per 1,000 jobs at every tenth position in a ranking of 51 jurisdictions: the District of Columbia first at 157.532, Utah eleventh at 72.827, Kansas twenty-first at 63.998, Tennessee thirty-first at 57.798, Alabama forty-first at 51.169 and Mississippi fifty-first at 41.892. The first bar stands well clear of the rest, and the remaining five step down gently from 72.827 to 41.892.
A bar chart of business and financial operations workers per 1,000 jobs at every tenth position in a ranking of 51 jurisdictions: the District of Columbia first at 157.532, Utah eleventh at 72.827, Kansas twenty-first at 63.998, Tennessee thirty-first at 57.798, Alabama forty-first at 51.169 and Mississippi fifty-first at 41.892. The first bar stands well clear of the rest, and the remaining five step down gently from 72.827 to 41.892.
The spread is the finding. Mississippi holds 41.892 of these workers per thousand jobs, the lowest of the 51. Virginia holds 94.377, the highest of the states, which is 2.25 times Mississippi's rate. The District of Columbia holds 157.532, and that figure says more about the seat of the federal government than about any state. In 34 of the 51 jurisdictions the location quotient for this group is below one, meaning the group is less concentrated there than in the nation as a whole.
Thin benches are also cheap benches. Rank the jurisdictions by workers per thousand jobs, then rank them again by the median annual wage this group is paid, and six appear in the bottom ten of both lists: Mississippi, West Virginia, Kentucky, Louisiana, Indiana and Idaho. A county in one of those states is bidding for a scarce skill in a market that has not priced it as scarce. That is not a lending problem, and no interest rate reaches it.
Where this evidence stops
Four limits, stated rather than hedged. The construction series is national and covers nonresidential work of every kind, so it is not a municipal capital programme and nothing here treats it as one. The ten-year Treasury is not a municipal borrowing rate, and no municipal yield is held on this site. The occupational file is cross-industry, so it counts these workers wherever they are employed and does not isolate the ones on a local payroll. And it is a single year, with no history and nothing below state level.
Those limits cut one way more than the other. The finance claim makes a prediction that this data can test, and the prediction fails: money grew dearer by 3.40 points and nonresidential spending grew by 453 billion dollars a year. The capacity claim makes a prediction this data can illustrate but cannot confirm, that the ability to deliver varies from place to place. It varies from 41.892 per thousand to 94.377 across the states on the only measure available, and that variation is not something a cheaper coupon closes.
What would change my mind is a series this publication does not hold: borrowing costs by municipal issuer, or a count of planning and procurement staff inside local government. Until one exists, the choice lies between a constraint priced almost identically in every county and a constraint that runs from 41.892 to 94.377 across the states. Delivery is not identical across the country. I put the constraint where the variation is.
About the author

Each author told us that for this piece they hold no interest a reader would think relevant.
This commentary carries its author's name because the view in it is the author's own. An editor reviewed it before publication, which is not the same as agreeing with it. It is not a position of the Center for Economics & Foreign Affairs or of Applied America.
© 2025. The author or authors hold the copyright in this commentary; CEFA publishes it with their permission. This edition, its editing and its presentation are © 2025 Center for Economics & Foreign Affairs. To republish it, see our republication terms. Republishing
Share
The Cefa Brief · applied.thecefa.org/cefa-brief/a-bench-you-cannot-hire-in-a-year · Printed from the web edition