
Industrial strategy is a decade-long commitment made by institutions that are not built to hold one
Spending on manufacturing plant rose from a yearly rate of 75 billion dollars in 2020 to 244 in 2024, lifting the factory share of all nonresidential building from 8.8 percent to 18.8. Manufacturing employment reached its high for these six years in 2023 and is lower now, which is what it looks like when a country can order buildings faster than the institutions to run them.
by
Vantage point
I should say what this vantage is, because it decides everything that follows. I am an analyst writing inside The Cefa Brief, working from published statistics and public documents and from nothing else: annual series redistributed by FRED and retrieved for this site on 19 September 2026, together with the agencies' own documentation of what those series count. I hold no seat in any ministry and no brief from any government. Nothing below rests on a conversation, a draft, or a figure that has not been published.
Published 5 minute read

插图:The Cefa Brief
Between 2020 and 2024 American spending on manufacturing plant rose from 75 billion dollars to 244 billion, both figures at a seasonally adjusted annual rate, so each is a yearly rate and not a month's outlay. That is a change of 169 billion across four years, more than tripling the series. These figures record what was built. They do not say what ordered it, and no series here attributes a dollar of it to a policy. In 2025 the same series reads 215 billion. The line turned down before anyone could say whether the building had worked.
Where this is written from
I should say what this vantage is, because it decides everything that follows. I am an analyst writing inside The Cefa Brief, working from published statistics and public documents and from nothing else: annual series redistributed by FRED and retrieved for this site on 19 September 2026, together with the agencies' own documentation of what those series count. I hold no seat in any ministry and no brief from any government. Nothing below rests on a conversation, a draft, or a figure that has not been published.
That position sees a narrow thing well. It sees what the statistical agencies have chosen to count, at the frequency they publish it, on a national basis. It does not see the inside of a decision. Whether a particular plant received its permit, whether a particular appropriation was obligated, whether an official was competent or a contractor solvent: none of that reaches a national annual series, and I will not pretend to read it out of one. The strongest claim available from here is about traces, and a trace is not a cause.
The capital arrived first
The plant series runs 75, 82, 125, 202, 244 and 215 billion dollars across 2020 to 2025, each point a seasonally adjusted annual rate. The steps between those readings are 7, then 43, then 77, then 42, then minus 29. Capital is the fastest-moving part of an industrial strategy, and it is the part that needs no new institution to exist beforehand. A credit and a balance sheet are enough to move it.
Set the plant series against all nonresidential construction, which runs 856, 845, 968, 1193, 1295 and 1309 billion dollars over the same years on the same basis. Dividing one by the other gives the factory share of nonresidential building: 8.8 percent in 2020, 9.7 in 2021, 12.9 in 2022, 16.9 in 2023, 18.8 in 2024 and 16.4 in 2025. The share more than doubled between the start of the window and 2024. Both series come from the same agency, carry the same unit and are stated on the same basis, which is why the division is admissible; it is arithmetic on two published figures and nothing more.
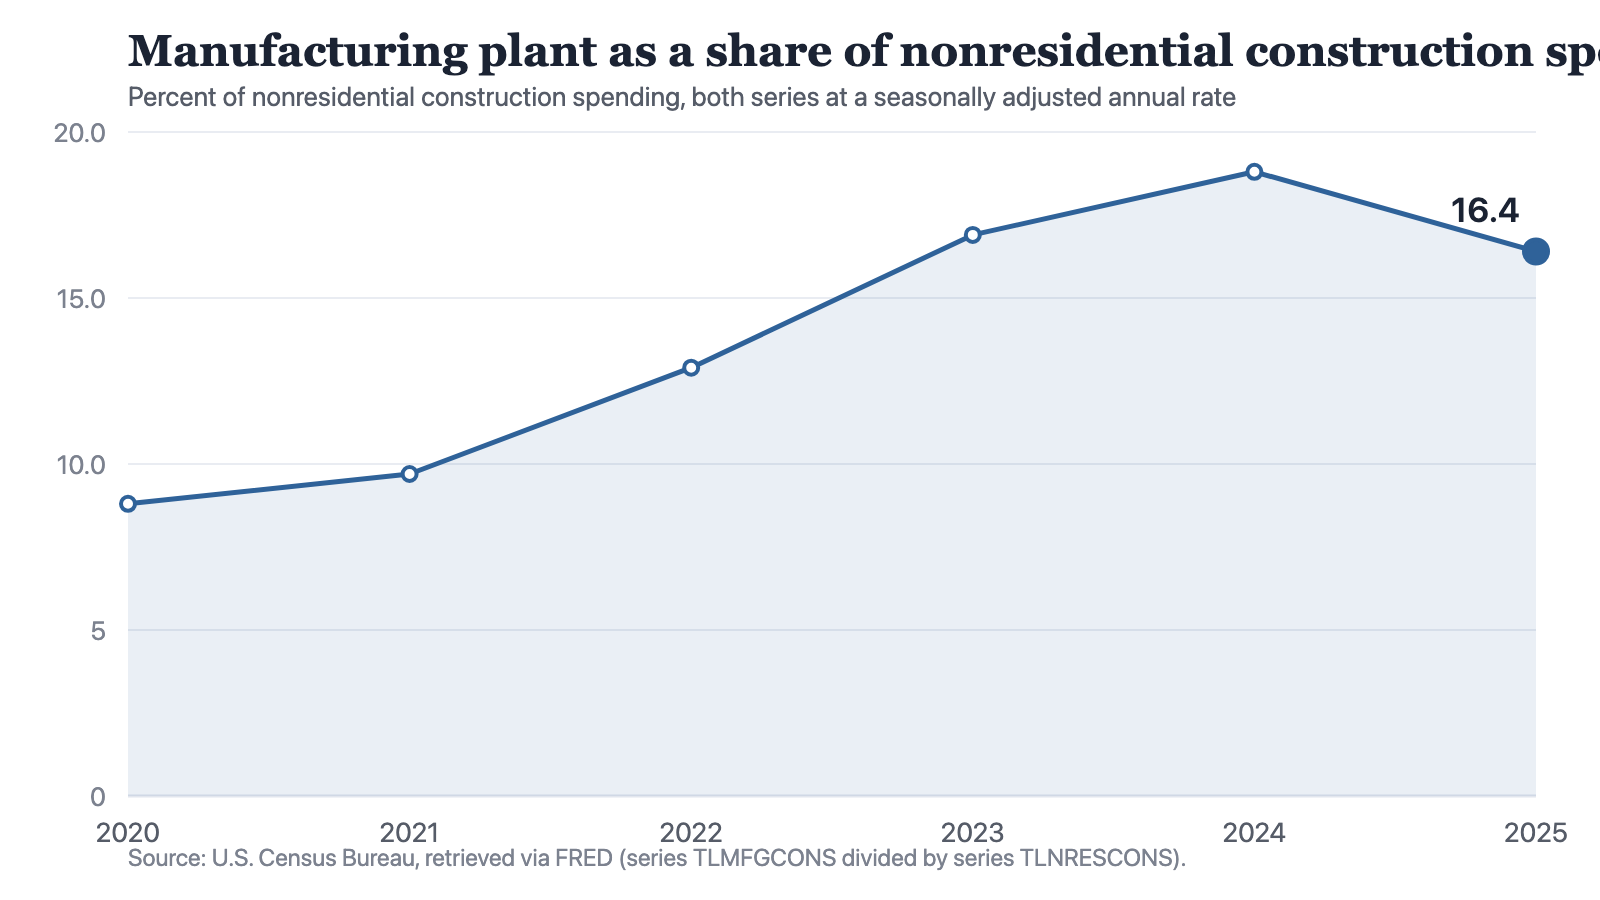
Notes: Manufacturing plant construction (series TLMFGCONS) divided by nonresidential construction spending (series TLNRESCONS), both U.S. Census Bureau, both in billions of dollars at a seasonally adjusted annual rate. Each underlying point is already a yearly rate and is not a monthly figure. The six percentages are arithmetic on published figures, not a published series.
Source: The Cefa Brief
Chart description
A line chart of manufacturing plant construction as a percentage of all nonresidential construction spending: 8.8 percent in 2020, 9.7 in 2021, 12.9 in 2022, 16.9 in 2023, 18.8 in 2024 and 16.4 in 2025. The line rises at every step to the 2024 peak of 18.8 percent, then falls 2.4 percentage points in the final year.
A line chart of manufacturing plant construction as a percentage of all nonresidential construction spending: 8.8 percent in 2020, 9.7 in 2021, 12.9 in 2022, 16.9 in 2023, 18.8 in 2024 and 16.4 in 2025. The line rises at every step to the 2024 peak of 18.8 percent, then falls 2.4 percentage points in the final year.
An institution that outlives the appropriation
The first institution an industrial strategy needs is one whose horizon is longer than the money. Plant spending fell 29 billion between 2024 and 2025 on a yearly-rate basis, and that fall arrived with the price of long money at the top of its own window. The ten-year Treasury yield ran 0.89 percent in 2020 and 4.29 percent in 2025, a rise of 3.4 points and more than four times the starting figure. A commitment priced in 2020 and refinanced in 2025 is not the same commitment. Nothing in these series identifies why the plant number turned, and I will not assign it a cause. What the pairing does establish is that the decade a strategy needs and the horizon its financing carries are different lengths, and only one of them is fixed by statute.
An institution that can commission people
Buildings can be ordered. Workforces cannot. Manufacturing employment across the same six years runs 12.1, 12.3, 12.8, 12.9, 12.8 and 12.6 million workers. The peak is 2023 at 12.9 million, and the series is 0.3 million lower in 2025, across precisely the three years in which plant spending posted its highest readings of 202, 244 and 215 billion. Manufacturing capacity in use says something similar from the other side: 77.6 percent in 2022, the highest reading in this window, then 76.6 in 2023, 75.4 in 2024 and 75.3 in 2025. That is a fall of 2.3 points across the same years in which plant spending went from 125 billion to 215.
A country can order a building inside a budget cycle. It cannot order a machinist, an inspectorate or a supply base on the same schedule.
Where the record moves, and where it does not
One part of the record did move. Semiconductor production, indexed to 2017 equals 100, runs 121 in 2021, 131 in 2022, 135 in 2023, 144 in 2024 and 165 in 2025: a gain of 44 index points, with the largest single step of 21 in the final year. Manufacturing output as a whole, on the same 2017 base, runs 93, 97.6, 98, 97.3, 96.4 and 97.3. The 2025 reading is identical to the 2023 reading and still 2.7 points below the base year. What separates those two lines is not more money against less, because the plant series does not break out by sector and cannot say where its dollars landed. It is that semiconductor production is a thing a statistical agency counts on its own, with its own index, while manufacturing in the aggregate is a collection of activities that share a classification. An aggregate has no institutions. Its parts do.
Why the institutions do not get built
My position is that the institutions an industrial strategy requires go unbuilt because their returns fall outside every cycle that would have to authorise them. A plant appears in a ribbon-cutting, and it appears in a construction series while it is still going up. An inspectorate, a training system, a procurement office able to write a competent specification, a statistical series long enough to settle an argument: none of those produces a countable result inside the term of the people who would fund it. The incentive runs entirely toward the thing that shows up fast, and the thing that shows up fast is the building. The record in front of me is consistent with that ordering. The construction line moved furthest and soonest, employment in the sector is lower in 2025 than in 2023, and the aggregate output index ends the window 2.7 points below its own 2017 base.
Let me be exact about what this does not establish. Six annual observations cannot date a turning point inside a year, cannot separate a strategy's effect from everything else occurring in the same years, and cannot say whether plant built inside the window is yet producing: the construction series counts buildings going up, the output indexes count production, and nothing here joins one to the other. A reader who wants to know whether the industrial policy of these six years worked will not find the answer in them. The absence of an institution whose job is to hold that question open until it can be answered is not a gap in the data. It is the finding.
How to cite
Jag DeSaint, "Industrial strategy is a decade-long commitment made by institutions that are not built to hold one," The Cefa Brief, Applied America, 2026年9月14日, https://applied.thecefa.org/cefa-brief/what-outlasts-the-appropriation.
About the author

Each author told us that for this piece they hold no interest a reader would think relevant.
This Perspectives piece carries its author's name because the view in it is the author's own. An editor reviewed it before publication, which is not the same as agreeing with it. It is not a position of the Center for Economics & Foreign Affairs or of Applied America.
© 2026. The author or authors hold the copyright in this Perspectives piece; CEFA publishes it with their permission. This edition, its editing and its presentation are © 2026 Center for Economics & Foreign Affairs. To republish it, see our republication terms. Republishing
Share
The Cefa Brief · applied.thecefa.org/cefa-brief/what-outlasts-the-appropriation · Printed from the web edition