
Real output per person rose again in 2025, by less than in any earlier year of the window
Output per person has risen at every reading, from 61,127 chained 2017 dollars in 2020 to 69,749 in 2025, but the step into 2025 is 1,068 dollars and it is the smallest of the five. The total the figure is drawn from slowed in the same year, adding 0.49 trillion dollars against 0.64 in each of the two years before it, so the flatter step is not a story about population alone.
by
Published 3 minute read

插图:The Cefa Brief
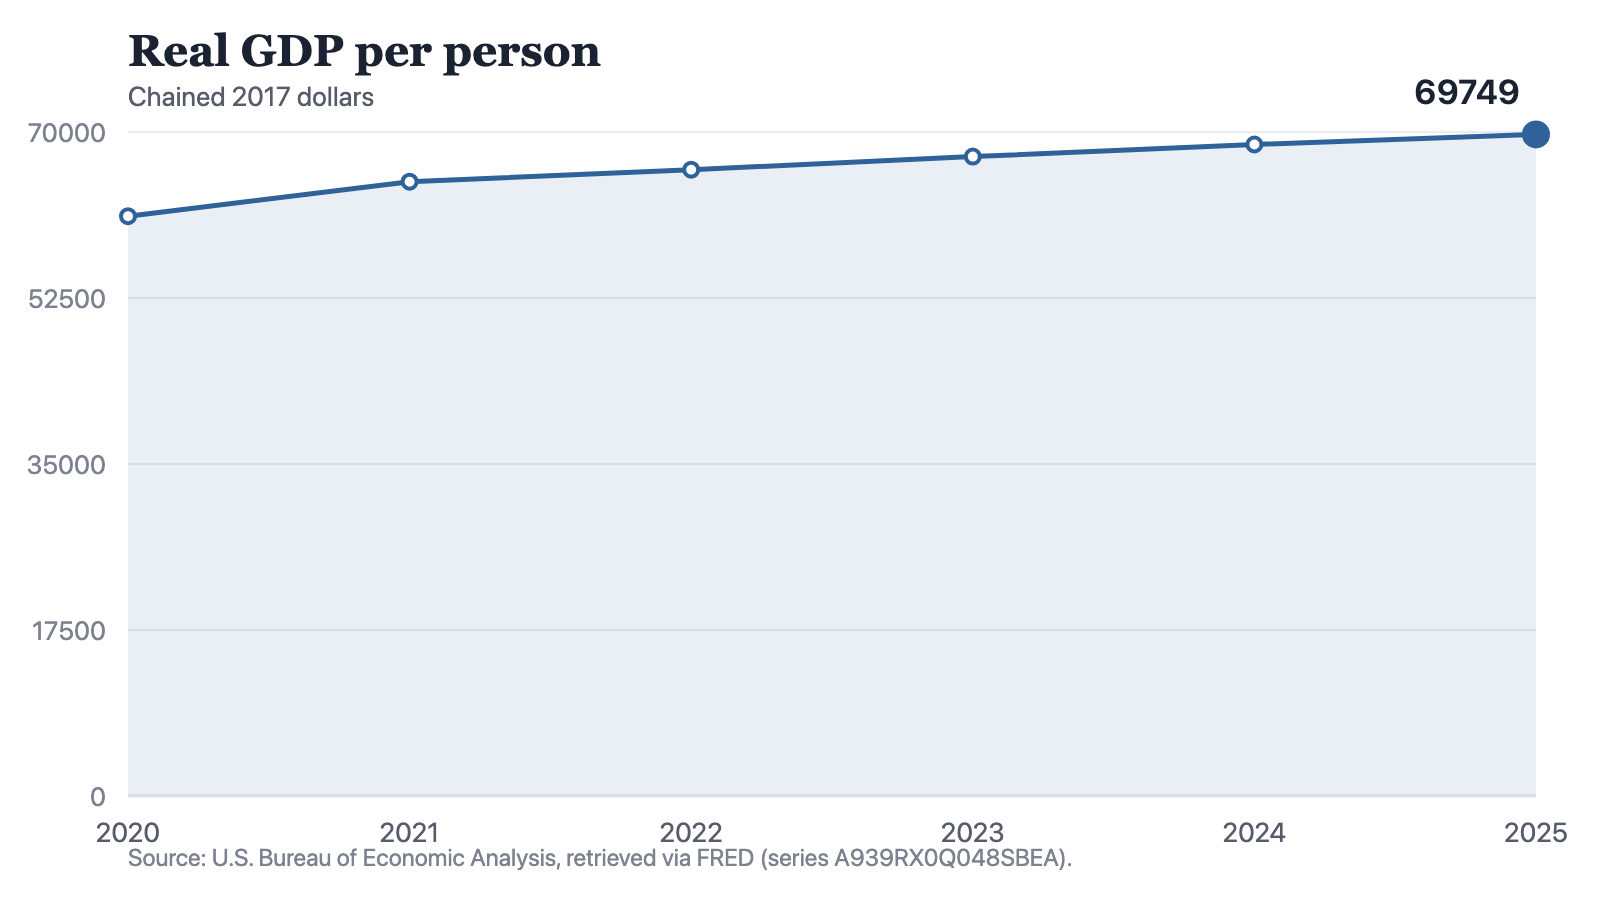
Real output per person is higher in 2025 than in any earlier reading of this series. The six annual figures run 61,127 chained 2017 dollars in 2020, 64,758 in 2021, 66,026 in 2022, 67,411 in 2023, 68,681 in 2024 and 69,749 in 2025. There is no down year, and the window as a whole adds 8,622 dollars.
What changes across those six readings is not the direction but the size of the step. The five increases are 3,631 dollars, then 1,268, then 1,385, then 1,270, then 1,068. The first of them is larger than any two of the four that follow it added together.
The rebound and the four years after
Between 2020 and 2021 the series added 3,631 dollars. The four years after it added 4,991 dollars between them, which is 1,360 more than that one year produced on its own. Those four steps also sit inside a narrow band, 1,068 dollars at the bottom and 1,385 at the top, a spread of 317 dollars across four years.
Notes: Annual observations stated in the prices of 2017, so the series already carries its own price adjustment. It is output divided by a count of people, a mean rather than a median, and it holds nothing about how the output is distributed.
Source: The Cefa Brief
Chart description
A line chart showing real output per person at 61,127 chained 2017 dollars in 2020, 64,758 in 2021, 66,026 in 2022, 67,411 in 2023, 68,681 in 2024 and 69,749 in 2025. The line rises at every step. The first section adds 3,631 dollars and is much the steepest; the four that follow add 1,268, 1,385, 1,270 and 1,068 dollars, so the closing section from 2024 to 2025 is the shallowest in the chart.
A line chart showing real output per person at 61,127 chained 2017 dollars in 2020, 64,758 in 2021, 66,026 in 2022, 67,411 in 2023, 68,681 in 2024 and 69,749 in 2025. The line rises at every step. The first section adds 3,631 dollars and is much the steepest; the four that follow add 1,268, 1,385, 1,270 and 1,068 dollars, so the closing section from 2024 to 2025 is the shallowest in the chart.
A line that rises at every reading is easy to present as steady progress. The increments describe something flatter than that. One large recovery year stands at the front of the window, and each of the four years since has added an amount inside a range 317 dollars wide, with the most recent of them at the bottom of that range.
The total, for comparison
Real gross domestic product, the same output before it is divided by a count of people, runs 20.28 trillion chained 2017 dollars in 2020, 21.53 in 2021, 22.08 in 2022, 22.72 in 2023, 23.36 in 2024 and 23.85 in 2025. Its five annual increases are 1.25 trillion, 0.55, 0.64, 0.64 and 0.49. The last of them is the smallest of the five, as it is in the per-person series.
That bears directly on how the 2025 per-person figure should be read. A smaller gain per person can arise because output grew by less or because the count of people grew by more. In 2025 the total itself added less than in any year since 2021, so the slower step per person does not require a population explanation to account for it.
A per-person figure can fall behind because the output slowed or because the count of people rose. The line itself does not say which.
Where the two series part
One place in the window has the two series moving differently. Real output added 0.64 trillion dollars in 2023 and 0.64 trillion again in 2024, the same figure to the precision these numbers carry. Per person, those two years added 1,385 dollars and then 1,270, a difference of 115 dollars. The addition to the total is recorded as the same in both years. The addition per person is not.
Two cautions sit under that comparison. The totals are stored to two decimal places in trillions, so the smallest difference they can express is 0.01 trillion, or 10 billion dollars. The year that closes one increase opens the next, and each stored figure carries its own rounding, so two increases recorded as equal can in truth differ by as much as 0.02 trillion, which is 20 billion dollars. Nothing above divides one series by the other either. Were the two increases exactly equal, the smaller step per person would require that the count of people grew; at the precision these figures carry, part of the 115 dollars may instead sit in the output. Neither series states the count of people, and nothing here derives it.
What the per-person figure is not
The series is a mean. It divides output by a count of people and reports the quotient, which is not what any household receives and not what any worker is paid. It says nothing about how the output is spread, and a year in which the mean rises is consistent with a great many arrangements underneath it.
The defensible reading is narrow. Output per person, held in the prices of 2017, rose at every step of the window, and the 2025 rise of 1,068 dollars is the smallest of the five. The total it comes from slowed in the same year. Who received the gain, whether the pace is adequate, and what either implies for the years ahead all rest on evidence this series does not hold.
Method and data
The figures are annual observations of real gross domestic product per person, series A939RX0Q048SBEA, published by the U.S. Bureau of Economic Analysis, redistributed by FRED and retrieved for this site on 19 September 2026. The unit is chained 2017 dollars, so each point states a year's output per person in the prices of 2017 rather than in the prices of its own year. The points are levels and not rates of change, and no further price adjustment is applied to them here. The window stored for this site is six readings, 2020 to 2025, and nothing outside it is used here. It is a mean and not a median: it divides output by a count of people, a count that includes people who are not working and people who receive none of the output, and it carries nothing about distribution, about household income, or about what anyone is paid.
Real gross domestic product, series GDPC1, from the same agency and retrieved on the same date, is quoted for comparison. It is stated in trillions of chained 2017 dollars, the same price base as the per-person series, and is stored here to two decimal places, so the smallest difference these figures can express is 0.01 trillion, which is 10 billion dollars. Where the text calls two annual increases the same, it means the same to that precision and not to the dollar. No figure anywhere in this piece is obtained by dividing one of these two series by the other, and neither of them states the size of the population.
How to cite
Jag DeSaint, "Real output per person rose again in 2025, by less than in any earlier year of the window," The Cefa Brief, Applied America, 2025年10月6日, https://applied.thecefa.org/cefa-brief/the-rebound-and-the-four-years-after.
About the author

Each author told us that for this piece they hold no interest a reader would think relevant.
This Insights piece carries its author's name because the view in it is the author's own. An editor reviewed it before publication, which is not the same as agreeing with it. It is not a position of the Center for Economics & Foreign Affairs or of Applied America.
© 2025. The author or authors hold the copyright in this Insights piece; CEFA publishes it with their permission. This edition, its editing and its presentation are © 2025 Center for Economics & Foreign Affairs. To republish it, see our republication terms. Republishing
Share
The Cefa Brief · applied.thecefa.org/cefa-brief/the-rebound-and-the-four-years-after · Printed from the web edition