
Broad underemployment has risen in each of the last two years, to its highest reading since 2021
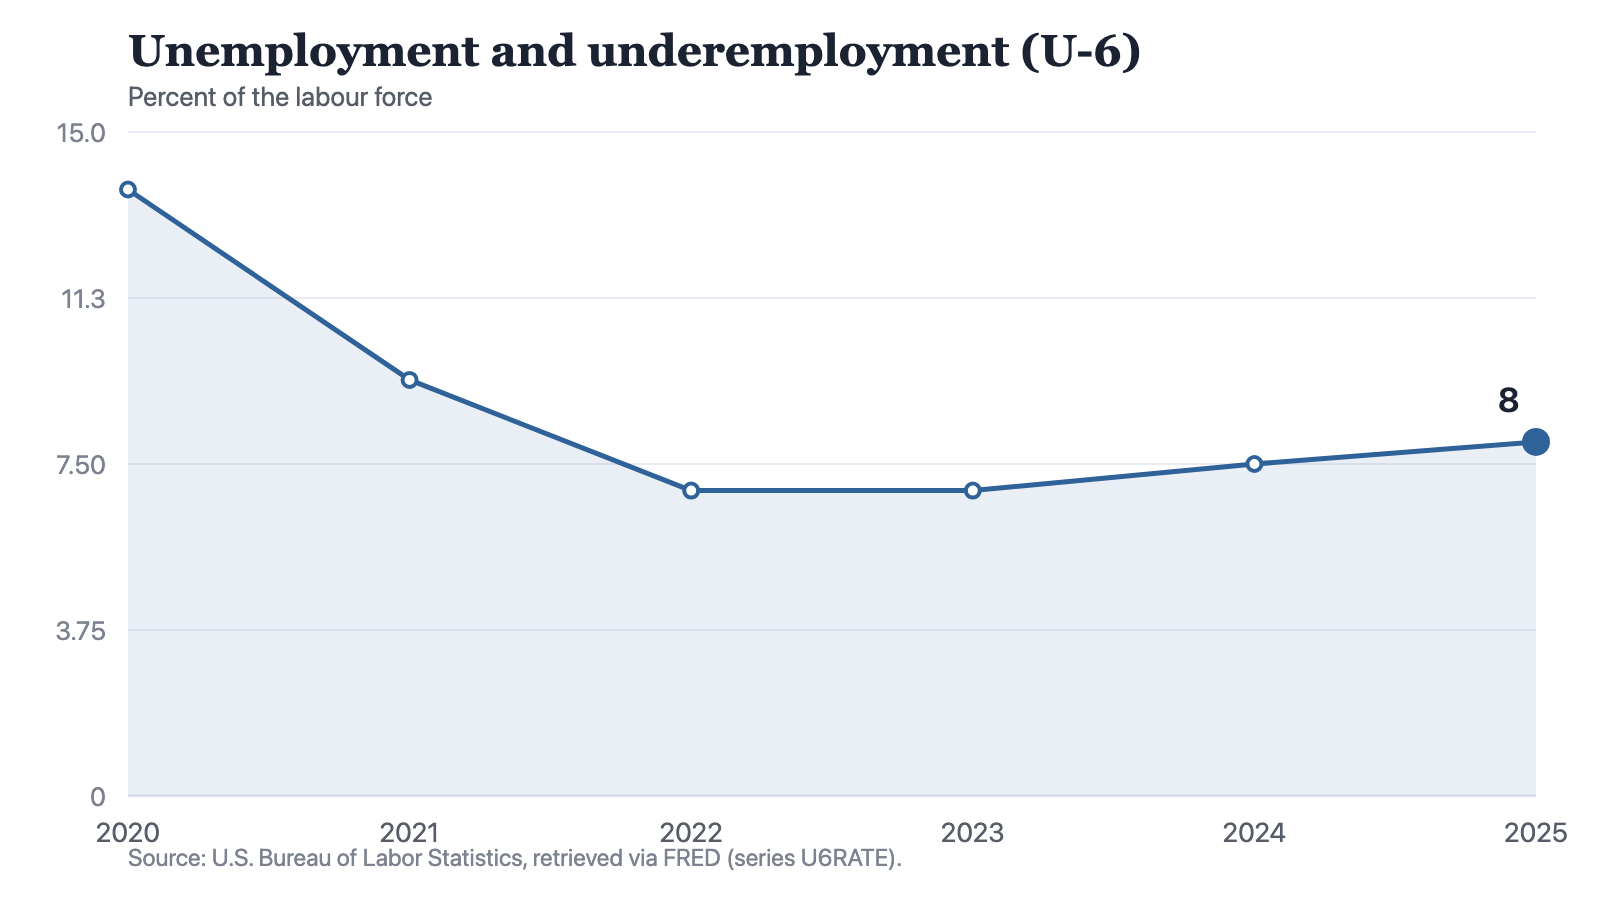
The U-6 rate fell from 13.7 percent of the labour force in 2020 to 6.9 in 2022, held at 6.9 in 2023, and has since risen to 7.5 and then 8. The 1.1 points it has added from that floor exceed the 0.7 the headline unemployment rate has added from its own, but as a multiple of the headline rate the broad measure has narrowed since 2023.
by
Published 3 minute read

插图:The Cefa Brief
The broad measure of unemployment and underemployment, U-6, has risen in each of the last two years. It stood at 8 percent of the labour force in 2025, the highest reading since 2021. The rise followed a floor of 6.9, which the series held for two years, in 2022 and again in 2023.
The six readings are 13.7 percent in 2020, 9.4 in 2021, 6.9 in 2022, 6.9 in 2023, 7.5 in 2024 and 8 in 2025. The fall from 2020 to 2022 is 6.8 points. The two rises since are 0.6 points and then 0.5, which is 1.1 points off the floor. The 2025 reading is still 5.7 points below where the window opens.
Notes: Annual observations. Each point is the annual observation as the source publishes it.
Source: The Cefa Brief
Chart description
A line chart of the U-6 unemployment and underemployment rate, as a percent of the labour force: 13.7 in 2020, 9.4 in 2021, 6.9 in 2022, 6.9 in 2023, 7.5 in 2024 and 8 in 2025. The line falls steeply across the first two steps, runs flat between 2022 and 2023 at 6.9, then rises in each of the last two years to end at 8, well below where it began.
A line chart of the U-6 unemployment and underemployment rate, as a percent of the labour force: 13.7 in 2020, 9.4 in 2021, 6.9 in 2022, 6.9 in 2023, 7.5 in 2024 and 8 in 2025. The line falls steeply across the first two steps, runs flat between 2022 and 2023 at 6.9, then rises in each of the last two years to end at 8, well below where it began.
The broad rate stopped falling a year earlier
The headline unemployment rate runs 8.1 percent in 2020, 5.4 in 2021, 3.7 in 2022, 3.6 in 2023, 4 in 2024 and 4.3 in 2025. Its lowest reading is 3.6, in 2023. The broad rate reached its own lowest, 6.9, in 2022, a year earlier, and did not fall again. From those floors the broad rate has added 1.1 points and the headline rate 0.7. Subtracting one series from the other gives a gap of 5.6 points in 2020, 4 in 2021, 3.2 in 2022, 3.3 in 2023, 3.5 in 2024 and 3.7 in 2025. The gap has widened at each of the last three steps, by 0.5 points in total since 2022.
The multiple went the other way
Dividing one rate by the other gives a different picture. The broad rate is 1.69 times the headline rate in 2020, 1.74 in 2021, 1.86 in 2022, 1.92 in 2023, 1.88 in 2024 and 1.86 in 2025, rounded to two decimal places. The widest gap in points, 5.6, sits in the year with the lowest multiple. The highest multiple, 1.92, sits in 2023, the year of the narrowest gap but one. Since 2023 the gap in points has widened by 0.4 while the multiple has fallen by 0.06.
A gap measured in points widens on its own when both rates rise together from a low base. Only the multiple tests whether the broad measure has grown relative to the narrow one, and over the last three years it has not: 1.86 in 2022 and 1.86 in 2025. The two calculations answer different questions, and the more alarming of them is the one that needs no change in composition to move.
What one number a year cannot separate
This site holds one annual figure for the broad measure and nothing beneath it. The 1.1 points added since 2023 cannot be attributed here to people working part time who would prefer full-time hours, to people at the edge of the labour force, or to unemployment itself, because the series does not carry those parts separately. The subtraction against the headline rate is the only split available, and a subtraction is not an explanation. A rate is also not a count: turning 8 percent into a number of people requires a labour-force level this series does not include.
Two rises make a run, not a trend. A 2026 reading below 8 would break it. A further rise of 0.5 points, the size of the last step, would put the reading at 8.5, which is nearer the 9.4 of 2021 than the floor of 6.9. The reading that would unsettle the second finding is different: a year in which the headline rate rises faster than the broad rate would narrow the gap and the multiple at once, and it is the multiple that would be doing the work.
Method and data
The figures are annual observations of the total unemployed plus underemployed rate, series U6RATE, published by the U.S. Bureau of Labor Statistics, redistributed by FRED and retrieved for this site on 19 September 2026. The unit as stored is percent of the labour force, so each point is one rate for that year and differences between points are percentage points rather than people; converting a rate into a count would need a labour-force level, which this series does not carry. The series holds only the combined rate and none of its components, so nothing here separates part-time work for economic reasons from attachment at the edge of the labour force or from unemployment itself. It is national, with no state, industry, age or duration detail. The headline unemployment rate quoted for contrast is a separate series, UNRATE, from the same agency and retrieved on the same date; the gaps and the multiples in the text are subtractions and divisions performed on those two stored series and on nothing else.
How to cite
Jag DeSaint, "Broad underemployment has risen in each of the last two years, to its highest reading since 2021," The Cefa Brief, Applied America, 2026年4月24日, https://applied.thecefa.org/cefa-brief/the-points-widened-the-multiple-did-not.
About the author

Each author told us that for this piece they hold no interest a reader would think relevant.
This Insights piece carries its author's name because the view in it is the author's own. An editor reviewed it before publication, which is not the same as agreeing with it. It is not a position of the Center for Economics & Foreign Affairs or of Applied America.
© 2026. The author or authors hold the copyright in this Insights piece; CEFA publishes it with their permission. This edition, its editing and its presentation are © 2026 Center for Economics & Foreign Affairs. To republish it, see our republication terms. Republishing
Share
The Cefa Brief · applied.thecefa.org/cefa-brief/the-points-widened-the-multiple-did-not · Printed from the web edition