
A state can only set a target on something its own accounts already count
A target can be written only on a quantity somebody already publishes, so the statistical system settles in advance which problems a government is able to own. The complication is that absence is not neutral: where no series covers a subject, the nearest published count is promoted into the gap, and the policy ends up governing whatever that count measures.
by
Vantage point
The vantage belongs at the start, because the argument leans on it. I am an analyst writing inside The Cefa Brief, working only from published statistics and public documents: the annual federal series cited below, redistributed by FRED and retrieved for this site on 19 September 2026, alongside five state-level files whose own headers state their agency, their vintage and the limit of their coverage. That position is well placed for one thing. It can see exactly which quantities are published, at what frequency, on which base and for which level of government, and what each file says about what it does not reach. It is badly placed for the thing that would settle the argument. I cannot observe a decision being taken. I have no sight of a minute, a submission or a target-setting meeting, so I cannot show that any official ever reached for the nearest published number instead of the right one. What I can show is which numbers were available to reach for, and which questions had none. Where the step from the second to the first is carrying the argument, the text says so rather than let the figures appear to do work they cannot do.
Published 7 minute read

插图:The Cefa Brief
A policy debate looks like a choice among options. Something narrower has already settled before the options appear. Somebody decided what would be counted, how often, over which territory and against which denominator, and those decisions were taken for reasons that had nothing to do with the question now being asked. A target can be written only on a quantity that is published, because a target on an unpublished quantity cannot be tested and so cannot be enforced against anyone. The statistical system is therefore not a record of what a state does. It is the list of things a state can be held to. What falls outside the list is not left alone; it is governed by whichever published number happens to sit nearest to it.
Where this is written from
The vantage belongs at the start, because the argument leans on it. I am an analyst writing inside The Cefa Brief, working only from published statistics and public documents: the annual federal series cited below, redistributed by FRED and retrieved for this site on 19 September 2026, alongside five state-level files whose own headers state their agency, their vintage and the limit of their coverage. That position is well placed for one thing. It can see exactly which quantities are published, at what frequency, on which base and for which level of government, and what each file says about what it does not reach. It is badly placed for the thing that would settle the argument. I cannot observe a decision being taken. I have no sight of a minute, a submission or a target-setting meeting, so I cannot show that any official ever reached for the nearest published number instead of the right one. What I can show is which numbers were available to reach for, and which questions had none. Where the step from the second to the first is carrying the argument, the text says so rather than let the figures appear to do work they cannot do.
Three decisions precede every target
Inside every published series are three decisions, all taken before any policy question arrived. The first is the definition, which fixes what the figure counts and the unit it is stated on: two series can carry the same subject noun, count different things, and be published on conventions that cannot be set side by side. The second is the jurisdiction, which fixes whose conduct the collection can reach. The third is the calendar, which fixes how often the figure appears and how old the newest one is. That third decision is visible on this site without any argument at all. The federal series here were retrieved on 19 September 2026. The per-state metrics file was fetched on 7 September 2026. State tax collections are the FY2025 survey, population is the Census Vintage 2024 estimate, the workforce file is the 2025 Occupational Employment and Wage Statistics, and the health and environment file is dated 2024. Six files, six stated dates. A question that needs all six is answered at six separate moments, and no amount of care in the writing closes that gap.
Three price levels, three answers
Consider the quantity most often named in a public target. Three measures of the American price level sit in this site's data, all official, all current, none a revision of another. The consumer price index for all urban consumers, on a 1982-84 base of 100, reads 258.9 in 2020 and 322 in 2025: a rise of 63.1 index points, which is 24.4 percent of the 2020 reading. Core consumer prices, on the same base, read 267.7 and 328, a rise of 60.3 points, or 22.5 percent. Core PCE prices, on a 2017 base of 100, read 105 and 126.3, a rise of 21.3 points, or 20.3 percent. Each of the three is an annual observation of a level, and each unit string carries no period qualifier. They differ because they were built to different definitions. Over the same five years, the widest answer and the narrowest stand 4.1 percentage points apart.
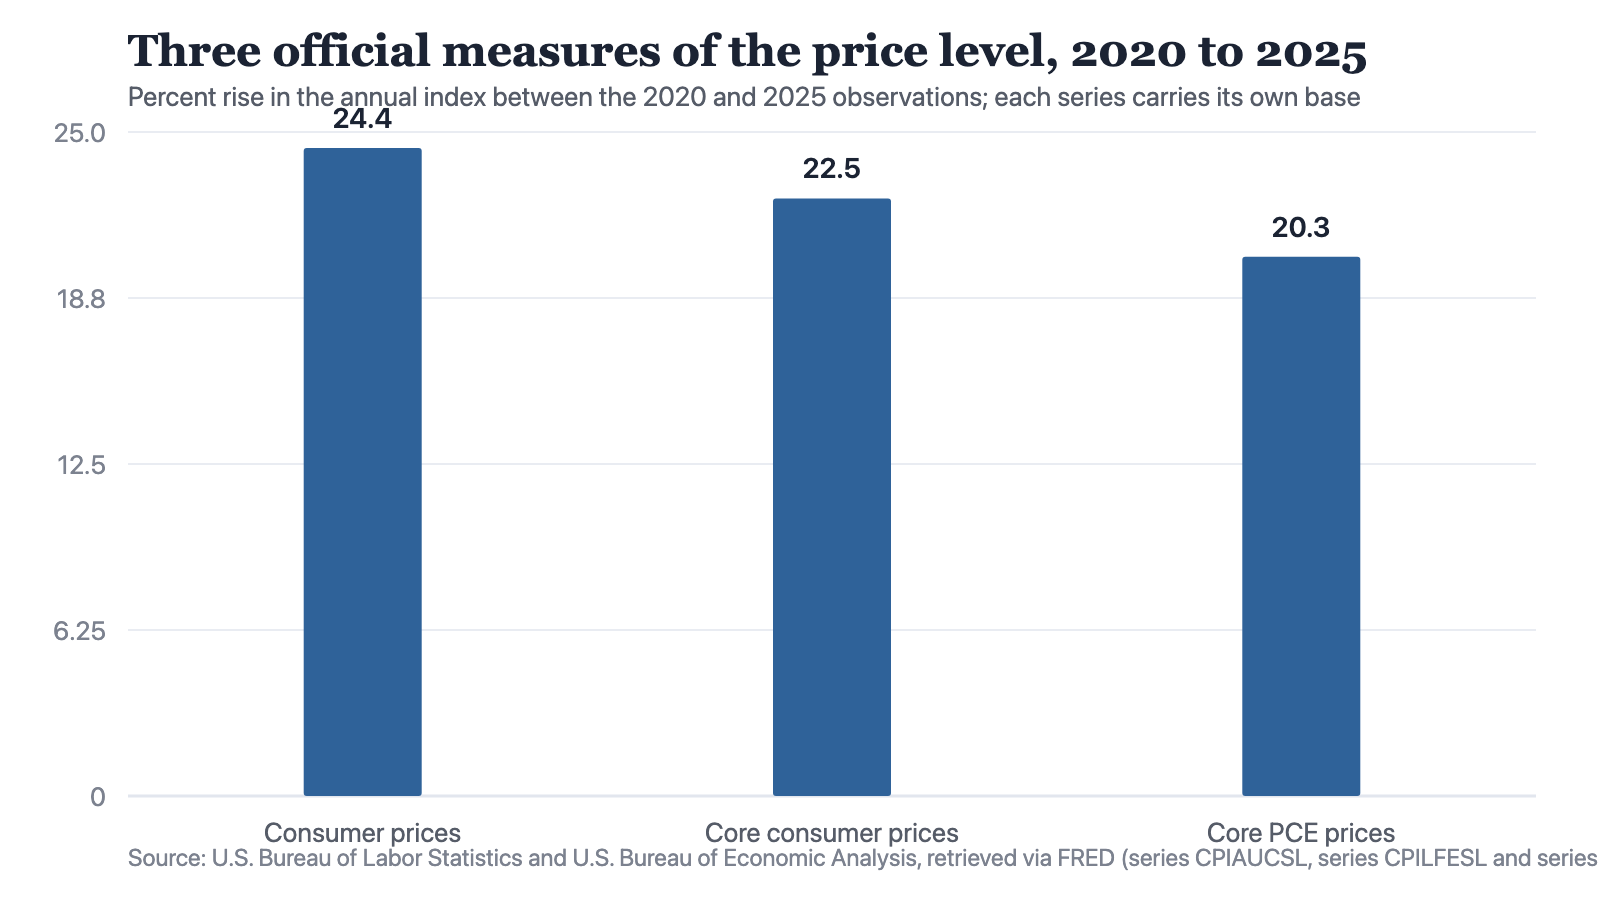
Notes: Arithmetic performed on copied annual index readings, all retrieved 19 September 2026. Consumer prices (series CPIAUCSL): 322 less 258.9, divided by 258.9. Core consumer prices (series CPILFESL): 328 less 267.7, divided by 267.7. Core PCE prices (series PCEPILFE): 126.3 less 105, divided by 105. Each result is stated to one decimal place. The three bars are percentages computed inside a single series; the index levels themselves are on two different bases and are never compared with one another.
Source: The Cefa Brief
Chart description
A bar chart of three values, each the percentage rise in an official price index between its 2020 and 2025 annual observations. Consumer prices, 24.4 percent. Core consumer prices, 22.5 percent. Core PCE prices, 20.3 percent. The bars fall in the order in which the three series are named, and the tallest and the shortest stand 4.1 percentage points apart.
A bar chart of three values, each the percentage rise in an official price index between its 2020 and 2025 annual observations. Consumer prices, 24.4 percent. Core consumer prices, 22.5 percent. Core PCE prices, 20.3 percent. The bars fall in the order in which the three series are named, and the tallest and the shortest stand 4.1 percentage points apart.
A target that names inflation without naming an index is therefore not a target. It is a commitment to be judged later against whichever of three published answers suits the moment, and in the window above the room for that judgement is 4.1 percentage points wide. The remedy is cheap and unattractive. Name the series, the base and the years in the text of the commitment itself rather than in a note beneath it, and accept that the named measure will sometimes be the one that makes the position look worse. An institution that declines to name it has not avoided the choice. It has moved the choice to the person who reports the outcome.
Nothing obliges a state to measure the problem. It is obliged only to publish something, and the something becomes the problem.
The measure follows the jurisdiction, not the phenomenon
The second decision is harder to see, because the file it produces is entirely accurate. The Census Bureau's annual survey of state government tax collections covers 51 jurisdictions for FY2025. In fourteen of them there is no property tax line: Colorado, Connecticut, Delaware, Florida, Hawaii, Idaho, New York, North Carolina, Ohio, Oklahoma, South Dakota, Tennessee, Texas and Utah. In six there is no individual income tax line: Alaska, Florida, Nevada, South Dakota, Texas and Wyoming. The second fact means what it appears to mean. The first does not. The survey reaches state-level levies, and local taxation lies outside it, so what the file records is that fourteen state governments collect no property tax of their own. A reader who converts that into fourteen states that do not tax property has not misread a number; the number is right. The reader has inherited the boundary the collection was drawn around, which is an administrative boundary rather than an economic one, and has then aimed at the tier of government the file happens to cover.
The unit decides which question can be asked
External balances show the first decision in its other form, the unit a series is stated on. Three of them sit in this site's data under three unit conventions. Net exports of goods and services, series NETEXP, carries the unit string Billions of dollars, seasonally adjusted annual rate; the source already states each period at a yearly rate, so the 2025 observation of minus 926 is a yearly rate and approximates the year. The balance on the current account, series IEABC, carries the unit string Billions of dollars, quarterly average; the source publishes a value for each quarter, and the 2025 point of minus 294 is the average of those quarters rather than the year's total. The trade balance in goods and services, series BOPGSTB, carries the unit string Billions of dollars, monthly average; the 2025 point of minus 78 is the average of the twelve months rather than the year's total. The three also count different things, and nothing on this site reconciles them. An instruction to reduce the deficit has therefore named no quantity, in no unit, at no frequency. It is not false. It simply cannot be checked, which in an institution amounts to the same thing.
What governs where nothing is counted
An absence does not leave a policy area empty. It leaves it to whatever series sits nearest. The clearest case here is environmental. The only state-level environmental figure on this site is a count of facilities reporting to the EPA's Toxics Release Inventory, running from 22 in the District of Columbia to 5,110 in California across 51 jurisdictions, and the file holding it states in its own header that a facility count is industrial density, not environmental quality. That distinction survives exactly as long as somebody reads the header. Sorted into a ranking, the same column becomes a league table of environmental performance in which a state that lost its industry is rewarded and a state hosting reporting plants is penalised. The count is honest; the use is not, and nothing in the data prevents it. Where a series is missing outright the file behaves better than its readers: the per-state metrics file names its two absences, manufacturing employment for Alabama and for the District of Columbia, so a chart of all 51 jurisdictions is a chart of 49 and says so. A named absence can be argued with. An absence nobody has written down is simply filled.
What follows
Three things follow, each dull enough to be dropped under pressure. First, an instrument should carry its series, its base and its level of government in the text of the commitment, because a target that names none of them is a target nobody can fail. Second, where no series covers a subject, the honest move is to say the subject is unmeasured and argue for it in words, rather than appoint the nearest count as its proxy and let a ranking do the reasoning. Third, and slowest, a state that wants to govern something new has to commission the measurement and then wait, because the instrument is upstream of everything it makes possible and no target written before its series exists can be enforced. What none of this establishes is whether any particular government behaves this way. Nothing published measures how an official chooses a number, this site holds no such series, and the claim stays where the evidence is: the measures exist or they do not, their boundaries are written in their own headers, and a policy aimed at a quantity nobody publishes is aimed at nothing anyone can check.
How to cite
Jag DeSaint, "A state can only set a target on something its own accounts already count," The Cefa Brief, Applied America, 2026年9月29日, https://applied.thecefa.org/cefa-brief/the-nearest-published-number-wins.
About the author

Each author told us that for this piece they hold no interest a reader would think relevant.
This Perspectives piece carries its author's name because the view in it is the author's own. An editor reviewed it before publication, which is not the same as agreeing with it. It is not a position of the Center for Economics & Foreign Affairs or of Applied America.
© 2026. The author or authors hold the copyright in this Perspectives piece; CEFA publishes it with their permission. This edition, its editing and its presentation are © 2026 Center for Economics & Foreign Affairs. To republish it, see our republication terms. Republishing
Share
The Cefa Brief · applied.thecefa.org/cefa-brief/the-nearest-published-number-wins · Printed from the web edition