
The debt ratio fell for three years while the debt itself rose in every year the series records
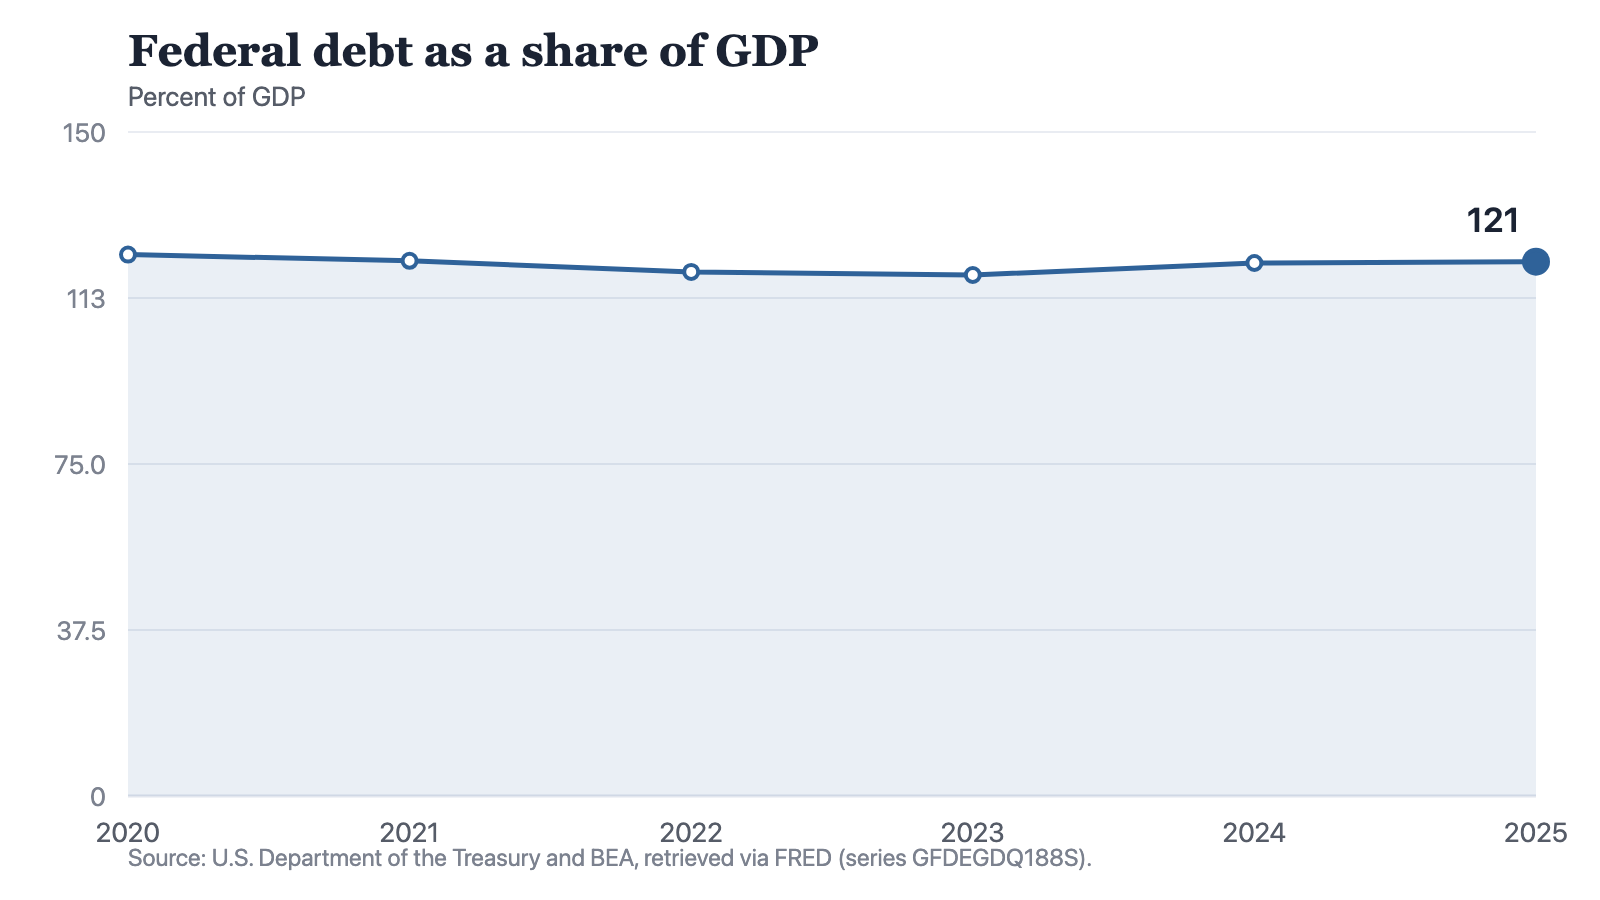
Federal debt as a share of GDP fell from 122.3 percent in 2020 to 117.7 in 2023, then turned and reached 120.7 in 2025. The debt rose in every year the same file records, so what fell in those three years was the ratio and not the obligation.
by
Published 3 minute read

插图:The Cefa Brief
Federal debt as a share of GDP stood at 120.7 percent in 2025. In 2020 it stood at 122.3 percent. On those two readings alone the burden is 1.6 points lighter than it was at the start of the window, and the direction looks like down.
The path between them is not a slope. The six annual readings run 122.3 in 2020, 120.9 in 2021, 118.4 in 2022, 117.7 in 2023, 120.4 in 2024 and 120.7 in 2025, each a percent of GDP. The series falls for three years to 117.7, its lowest point, and then rises for two. It has given back 3.0 of the 4.6 points it lost.
Nothing on the debt side fell
The debt itself rose in every year the same file records. Federal debt held by the public and intragovernmental reads 28.7 trillion dollars in 2021, 30.8 in 2022, 32.7 in 2023, 35.3 in 2024 and 37.1 in 2025. Across those five readings it added 8.4 trillion dollars. In 2023, the year the ratio reached its low, the debt series was 1.9 trillion dollars higher than the year before.
Notes: Annual observations formed by averaging within the year, so no point is the ratio on a single date. The series does not separate debt held by the public from intragovernmental holdings.
Source: The Cefa Brief
Chart description
A line chart showing federal debt at 122.3 percent of GDP in 2020, 120.9 percent in 2021, 118.4 percent in 2022, 117.7 percent in 2023, 120.4 percent in 2024 and 120.7 percent in 2025. The line descends through the first four readings, reaches its low at 117.7 in 2023, rises 2.7 points into 2024 and then flattens, ending 1.6 points below the 2020 reading.
A line chart showing federal debt at 122.3 percent of GDP in 2020, 120.9 percent in 2021, 118.4 percent in 2022, 117.7 percent in 2023, 120.4 percent in 2024 and 120.7 percent in 2025. The line descends through the first four readings, reaches its low at 117.7 in 2023, rises 2.7 points into 2024 and then flattens, ending 1.6 points below the 2020 reading.
That debt series carries five readings, one fewer than the ratio, and it begins in 2021. What the debt did between 2020 and 2021 is not in this file. Everything after that point is a rise.
Which side moved, and when
A ratio falls when the denominator grows faster in proportion than the numerator does. The file holds a series for each side, and the comparison can be made for three years, because current-dollar GDP begins in 2022.
Take 2023. The debt series grew from 30.8 to 32.7 trillion dollars, a rise of 6.2 percent. Current-dollar GDP grew from 26.1 to 27.8 trillion dollars, a rise of 6.5 percent. Output in dollars grew the faster of the two, and the ratio fell seven-tenths of a point.
In 2024 the order reversed. Debt grew 8.0 percent, from 32.7 to 35.3 trillion dollars, while GDP grew 5.4 percent, from 27.8 to 29.3 trillion. The ratio rose 2.7 points, the largest single-year move anywhere in the six readings, and it carried the series back above its 2022 level.
The final year is the one these figures cannot settle. Debt grew 5.1 percent and GDP grew 5.1 percent, on annual levels rounded to a tenth of a trillion dollars. A difference small enough to disappear into that rounding cannot be recovered from it. The ratio moved three-tenths of a point, to 120.7.
A debt ratio that falls while the debt rises has not been repaid. It has been outgrown.
What the measure is
Each annual point is drawn from FRED at annual frequency with the averaging method, so a year's figure is the average of the underlying periods within that year and not the level on any single date. The 2025 reading is not the ratio on the last day of 2025. The same treatment applies to the debt and output series quoted beside it, which is why this piece compares their growth rates rather than dividing one by the other to rebuild the ratio.
Three things the series does not carry. It does not separate debt held by the public from intragovernmental holdings, and neither does the debt series alongside it, whose own title names both. It prices nothing: no interest cost, no maturity, no holder appears anywhere in it. And it stops at 2025, so whether three-tenths of a point in the final year is the beginning of a climb or the end of one is not a question six annual readings can answer.
The defensible sentence is short. Federal debt as a share of GDP is 1.6 points below where it was in 2020, the fall happened in the three years to 2023, and it happened while the debt rose in every year the file records. Which of those two facts a reader is asking about decides whether this counts as improvement.
Method and data
The figures are annual observations of federal debt as a share of GDP, series GFDEGDQ188S, published by the U.S. Department of the Treasury with the Bureau of Economic Analysis, redistributed by FRED and retrieved for this site on 19 September 2026. The unit is percent of GDP. Each annual point is requested from FRED at annual frequency with the averaging method, so a year's figure is the average of the underlying periods within that year and not the ratio on any single date; the 2025 reading is not a year-end figure. The window is six readings, 2020 to 2025, and the series holds nothing before or after them. It does not separate debt held by the public from intragovernmental holdings, and it carries nothing about the interest paid on the debt, its maturity, who holds it, or any state or local borrowing.
Two further series from the same file are quoted, one for each side of the ratio. Federal debt held by the public and intragovernmental, series GFDEBTN, U.S. Department of the Treasury, carries five annual readings beginning in 2021, one fewer than the ratio, so the change on the debt side between 2020 and 2021 is not available here. Current-dollar gross domestic product, series GDP, U.S. Bureau of Economic Analysis, carries four annual readings beginning in 2022, which is why year-on-year growth is compared only for 2023, 2024 and 2025. Both were retrieved on 19 September 2026 and both are annual points formed by averaging within the year, and the GDP series is in current dollars with no adjustment for prices. This piece compares the growth rates of those two series. It does not divide one by the other, and no figure here is a reconstruction of the ratio.
Data sources
- U.S. Department of the Treasury and BEA, federal debt as a share of GDP (series GFDEGDQ188S), retrieved via FRED (外部网站)
- U.S. Department of the Treasury, federal debt held by the public and intragovernmental (series GFDEBTN), retrieved via FRED (外部网站)
- U.S. Bureau of Economic Analysis, gross domestic product in current dollars (series GDP), retrieved via FRED (外部网站)
How to cite
Jag DeSaint, "The debt ratio fell for three years while the debt itself rose in every year the series records," The Cefa Brief, Applied America, 2026年3月4日, https://applied.thecefa.org/cefa-brief/the-denominator-did-the-work.
About the author

Each author told us that for this piece they hold no interest a reader would think relevant.
This Insights piece carries its author's name because the view in it is the author's own. An editor reviewed it before publication, which is not the same as agreeing with it. It is not a position of the Center for Economics & Foreign Affairs or of Applied America.
© 2026. The author or authors hold the copyright in this Insights piece; CEFA publishes it with their permission. This edition, its editing and its presentation are © 2026 Center for Economics & Foreign Affairs. To republish it, see our republication terms. Republishing
Share
The Cefa Brief · applied.thecefa.org/cefa-brief/the-denominator-did-the-work · Printed from the web edition