
How the jobs in an economic impact claim are counted
An announced job number is the output of a model, not a headcount. By the end you will know the three layers such a figure can contain, the difference between a job and a job-year, and what to ask before setting two claims side by side.
Prepared by
Last reviewed Published 3 minute read

插图:The Cefa Brief
A number of jobs attached to an announced project is almost never a headcount. It is the output of an economic model, run before anything is built, on assumptions the modeller chose. The figure can be produced honestly and still mean something quite different from what a reader takes it to mean.
Impact models report in three layers. Direct jobs are at the project: the people who build it, and later the people who run it. Indirect jobs are at suppliers, the concrete plant and the electrical contractor and the firm that services the machines. Induced jobs are those supported when all of those workers spend their wages locally. The layers are added using multipliers taken from an input-output table of the regional economy, such as the Bureau of Economic Analysis's RIMS II tables or a proprietary equivalent. A claim that reports only a total does not say how much of it is the first layer, and the first layer is the only one anybody can go and count.
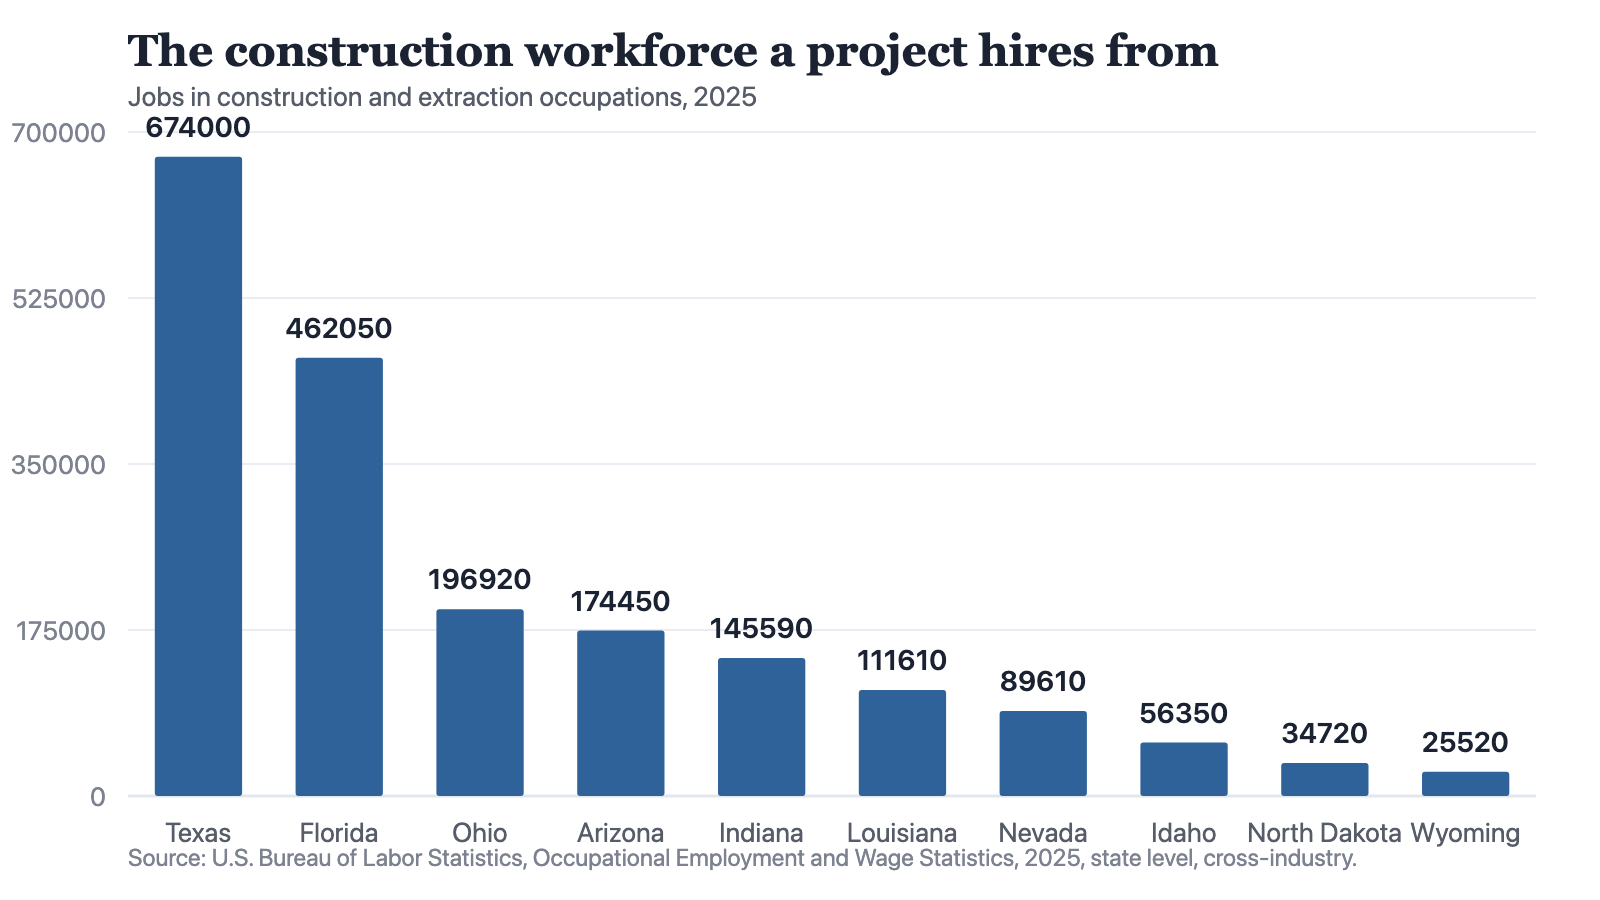
Notes: Source: U.S. Bureau of Labor Statistics, Occupational Employment and Wage Statistics, 2025, state level, cross-industry. Wage and salary employment only, so the self-employed are outside the count. Ten states shown to span a range of workforce sizes.
Source: The Cefa Brief
Chart description
Ten bars, ordered from longest to shortest, and the range is very wide. Texas leads with 674,000 jobs and Florida follows at 462,050, the two of them far longer than anything else on the chart. A large gap separates them from Ohio at 196,920, Arizona at 174,450 and Indiana at 145,590, which form a middle cluster. Louisiana sits at 111,610 and Nevada at 89,610. The final three are short: Idaho at 56,350, North Dakota at 34,720 and Wyoming at 25,520. Texas's bar is more than twenty-five times Wyoming's, and the chart falls away steeply after the first two rather than declining evenly.
Ten bars, ordered from longest to shortest, and the range is very wide. Texas leads with 674,000 jobs and Florida follows at 462,050, the two of them far longer than anything else on the chart. A large gap separates them from Ohio at 196,920, Arizona at 174,450 and Indiana at 145,590, which form a middle cluster. Louisiana sits at 111,610 and Nevada at 89,610. The final three are short: Idaho at 56,350, North Dakota at 34,720 and Wyoming at 25,520. Texas's bar is more than twenty-five times Wyoming's, and the chart falls away steeply after the first two rather than declining evenly.
A job, a job-year and a full-time equivalent
- A job-year is one job held for one year. A three-year build employing one crew is often reported as three times that crew.
- A full-time equivalent folds part-time and seasonal work into whole positions, so an equivalent count is smaller than a headcount for the same work.
- A construction-phase job ends when construction ends. An operating job lasts while the plant runs.
- Supported is a weaker word than created, and it usually covers all three layers, including work that already existed before the project was announced.
Adding construction-phase jobs to permanent operating jobs is the commonest way a total becomes large. They are different goods. A community weighing a tax abatement against a payroll wants to know how many of these jobs will still exist in the tenth year, and how many of those will be held by people who live in the county rather than by crews who follow the work from site to site.
Gross and net
Every impact figure is gross unless it says otherwise. It counts the jobs at the project and does not subtract the jobs those workers left, or the buildings that went unbuilt because the crews and the cranes were committed elsewhere. Where the local labour market has slack, the difference between gross and net is small. Where it is tight, the difference can be most of the number. This is where the chart earns its place. A claim expressed in thousands of construction jobs is one proposition in a state with a construction workforce the size of Texas's, and quite another where the entire occupational group is the size of Wyoming's. Same project, same model, same figure, different meaning.
Gross job figures count the arrivals. They do not count the departures that made the arrivals possible.
Where the disagreement is
Practitioners disagree about the induced layer and about displacement, and the argument is real. One position treats induced effects as genuine: wages are spent, the spending supports work that would not otherwise exist, and leaving the layer out understates what a project does for a region. The other holds that induced effects are the least verifiable part of the calculation, because the multipliers rest on spending patterns estimated for a region rather than observed for these workers, and that public appraisal should turn on direct and indirect jobs alone. Beneath that sits a harder question about the counterfactual: whether an economy near full employment gains jobs from a new plant at all, or mostly relocates them, in which case the defensible claim is about what gets produced and where, not about how many people work.
A test you can apply. Put four questions to any jobs figure. Which layers are inside it, direct only or direct, indirect and induced? Is the unit a job, a job-year or a full-time equivalent? Are construction-phase and operating jobs reported separately or added together? And what is the comparison case, the state of the world in which this project does not happen? A figure that answers all four can be set beside another figure. A figure that answers none of them cannot be compared with anything, including itself a year later.
About the author
Each author told us that for this piece they hold no interest a reader would think relevant.
Explainers are written and kept up to date by The Cefa Brief’s editors. An Explainer is background CEFA stands behind. It is not one author’s argument, and it is not a CEFA position on what anyone should do. If something here is wrong or out of date, write to applied@thecefa.org.
© 2025 Center for Economics & Foreign Affairs. To republish it, see our republication terms. Republishing
Share
The Cefa Brief · applied.thecefa.org/cefa-brief/how-jobs-created-is-counted · Printed from the web edition